Interesting Cases
December 2024: Chemotherapy Toxicity
History: A female patient presented to the emergency department with her family for progressive confusion. She had a history of pelvic malignancy which was currently being treated with chemotherapy. There were no focal neurologic deficits on physical exam. Imaging of the brain was ordered.
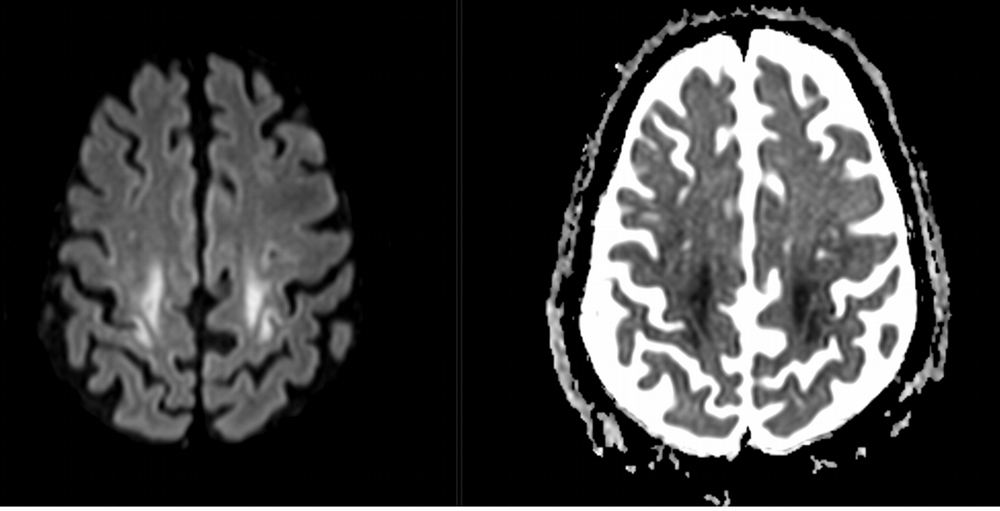
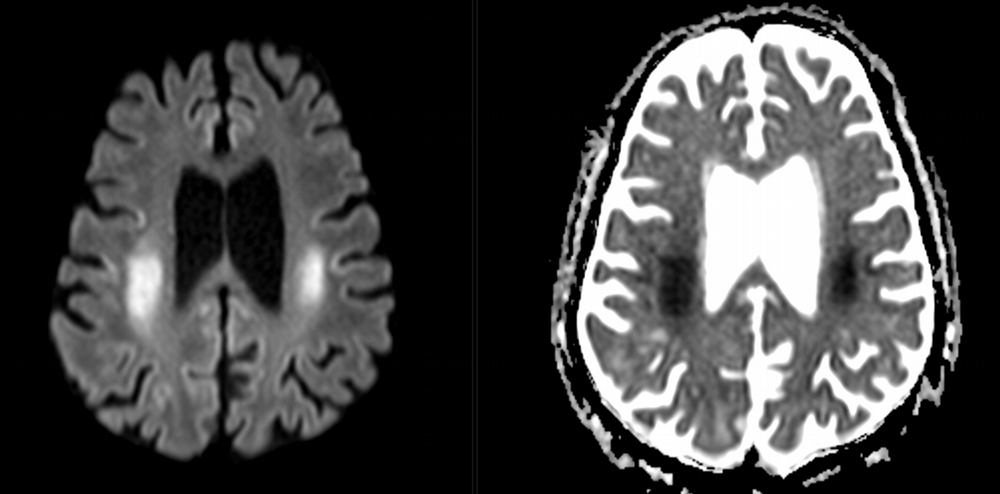
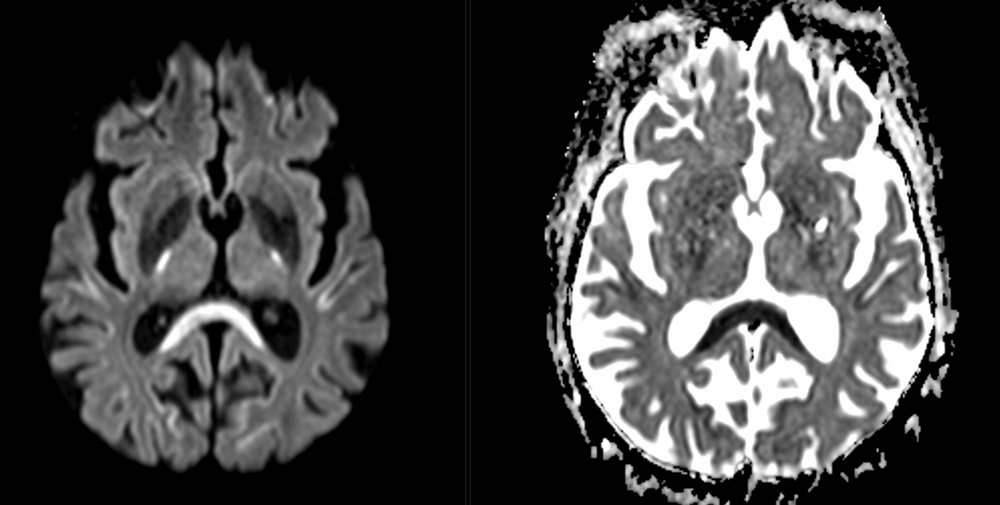
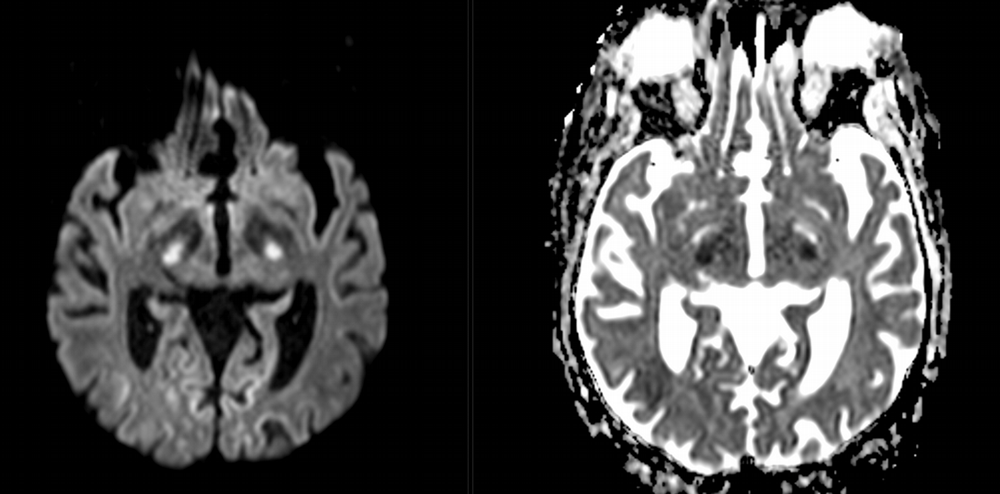
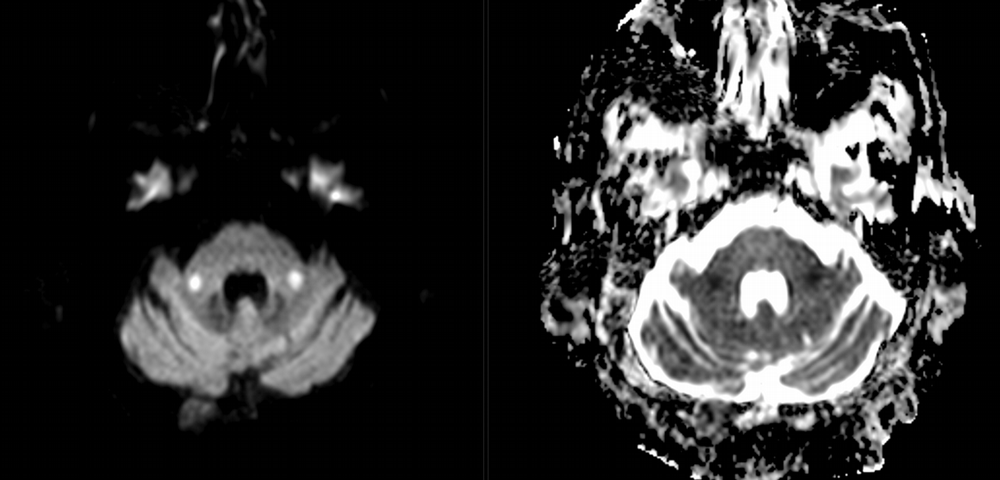
Imaging Findings: Noncontrast CT of the brain (not shown) was unremarkable. The isotropic diffusion weighted sequence (screen left) and corresponding apparent diffusion coefficient map (screen right) reveal symmetric diffusion restriction involving the white matter of the bilateral centrum semiovale, corona radiata, basal ganglia, splenium of the corpus callosum, and middle cerebral peduncles. There was no enhancement or gradient susceptibility associated with this signal abnormality.
Diagnosis: Toxic leukoencephalopathy
Course: The MR findings were suggestive of a metabolic or toxic encephalopathy, which can be seen with chemotherapy agents. The oncology service attributed this to the patient’s chemotherapy regimen, specifically the use of 5-fluorouracil which was subsequently discontinued. Vistogard (uridine triacetate) is a 5-FU antidote and was prescribed. The patient’s encephalopathy resolved shortly thereafter. Dihydropyrimidine dehydrogenase genotyping was performed which revealed a mutation resulting in impaired metabolism of 5-FU.
Discussion: Diffusion weighted imaging is classically associated with detection of ischemic stroke. Symmetric patterns of diffusion restriction such as in this case should prompt consideration of other pathologies, such as toxic or metabolic encephalopathy. A variety of agents including chemotherapy medications, illicit drugs, environmental toxins such as carbon monoxide, and metabolites such as ammonia can result in this pattern of diffusion restriction. Prompt discontinuation of the offending agent offers the best chance at recovery.
Previous Cases
November 2024: Traumatic Bowel Injury
History: A young adult is brought to the emergency department by EMS after a high-speed motor vehicle collision. Physical exam was notable for a seatbelt sign with diffuse abdominal tenderness. Cross-sectional imaging was performed after the initial trauma survey.
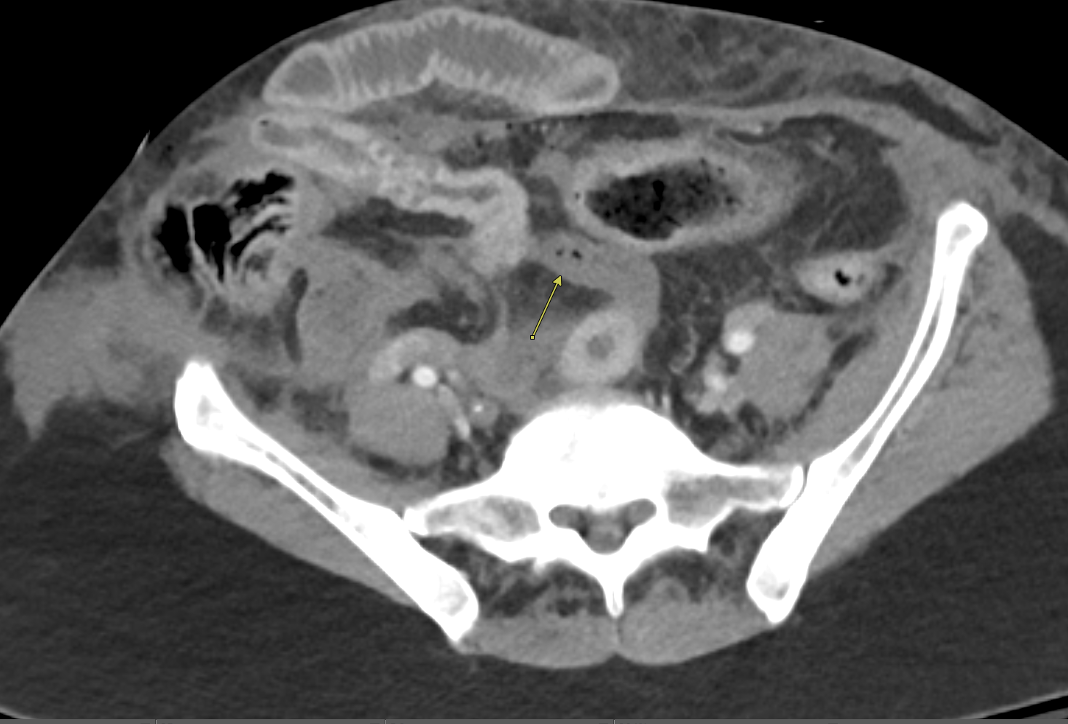
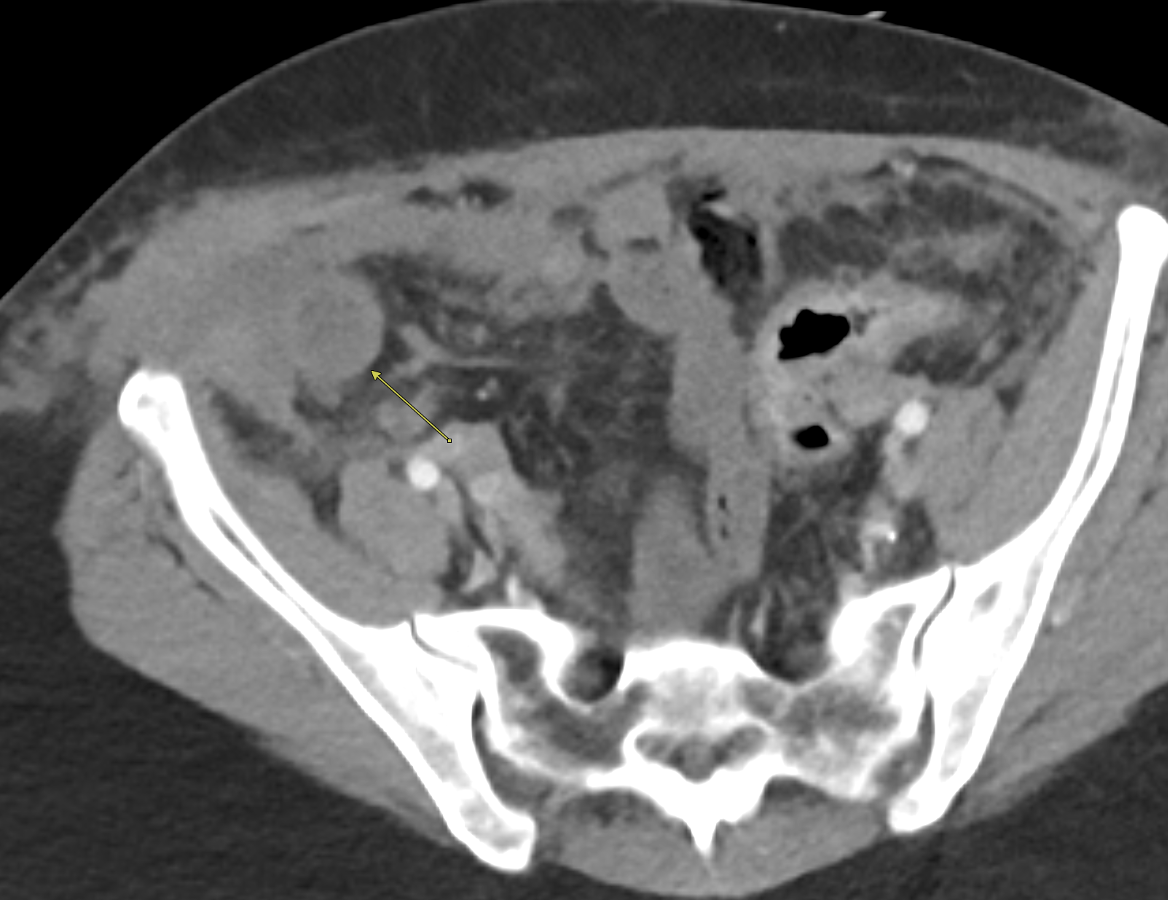
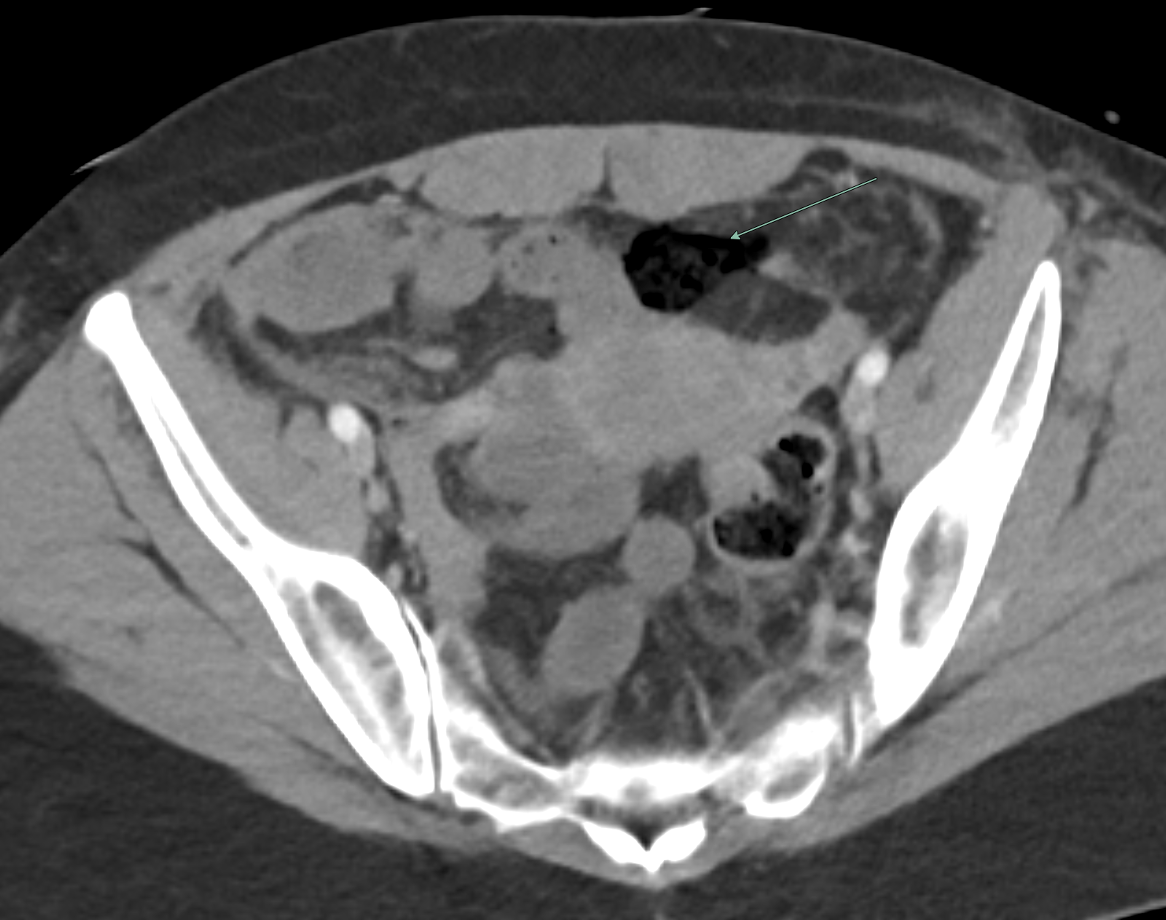
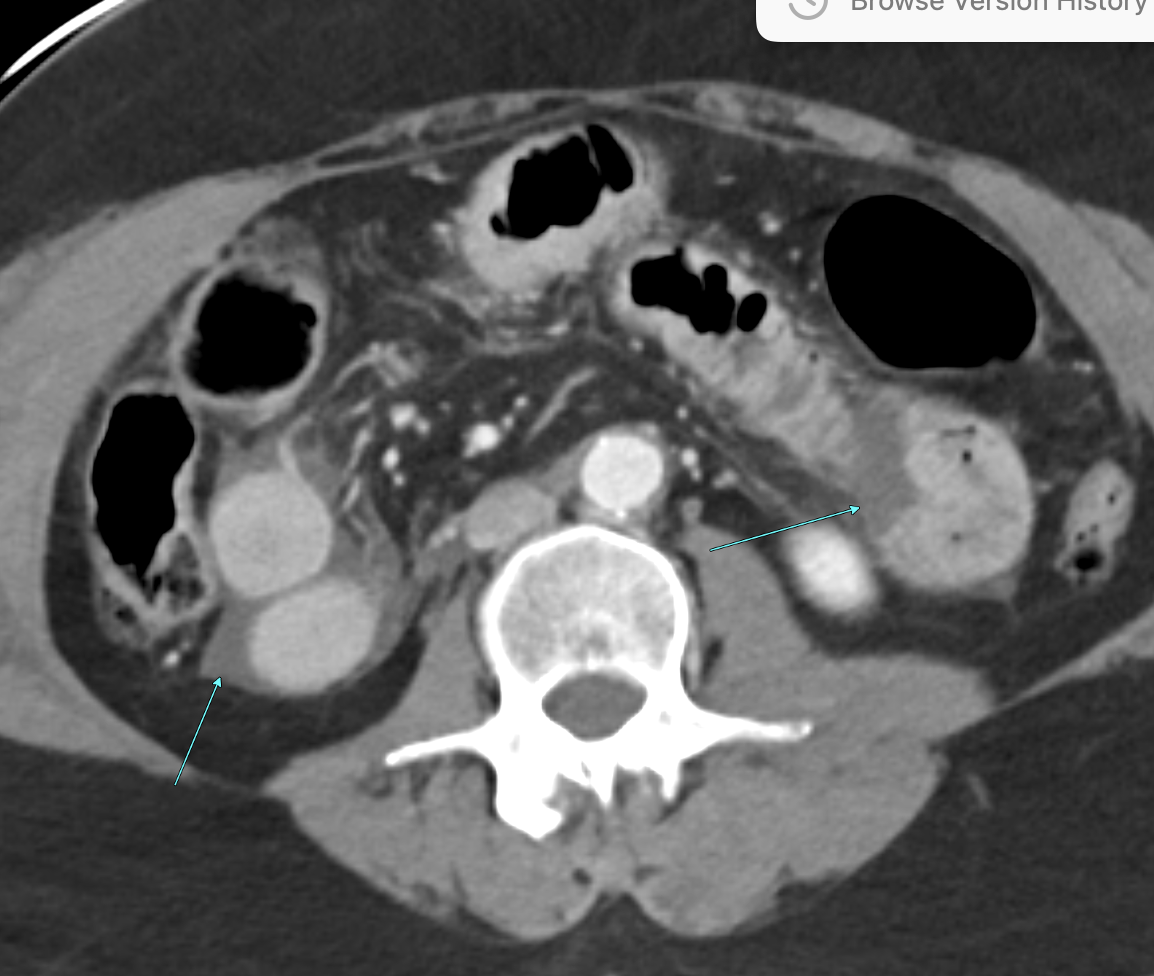
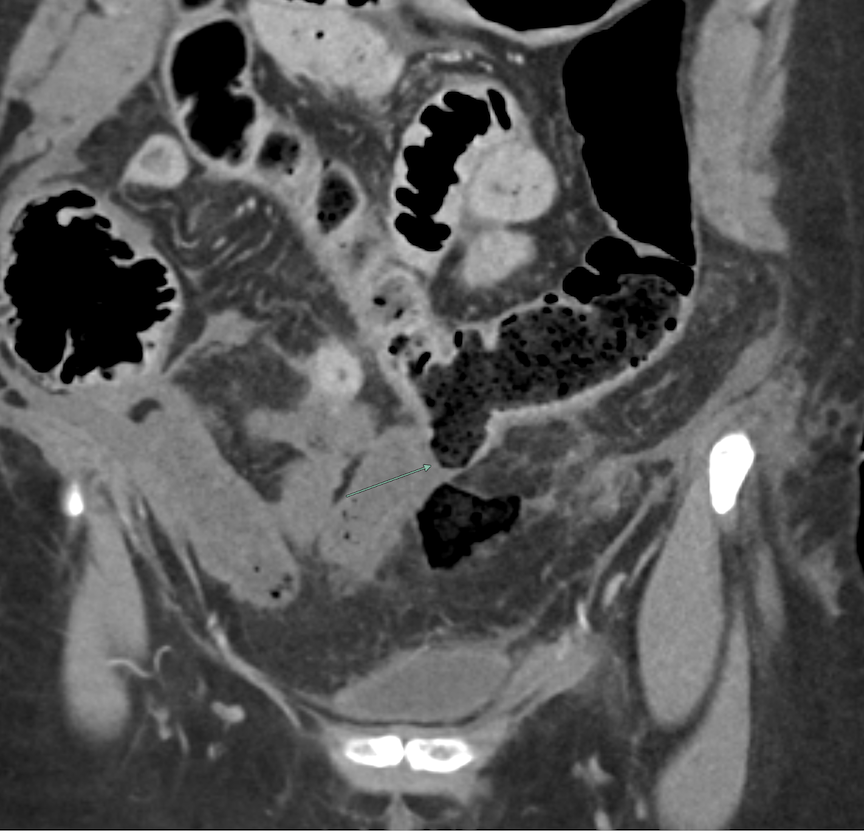
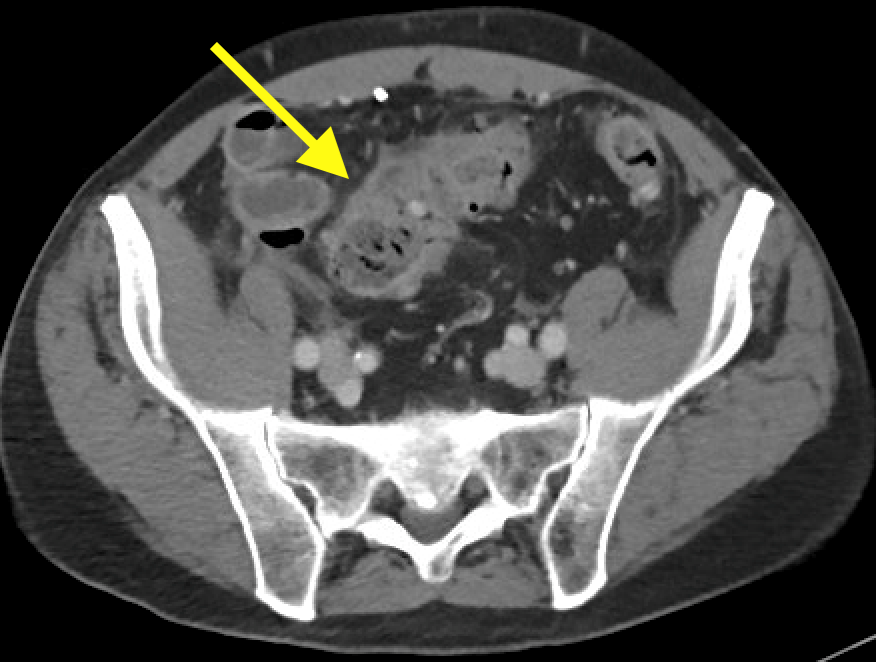
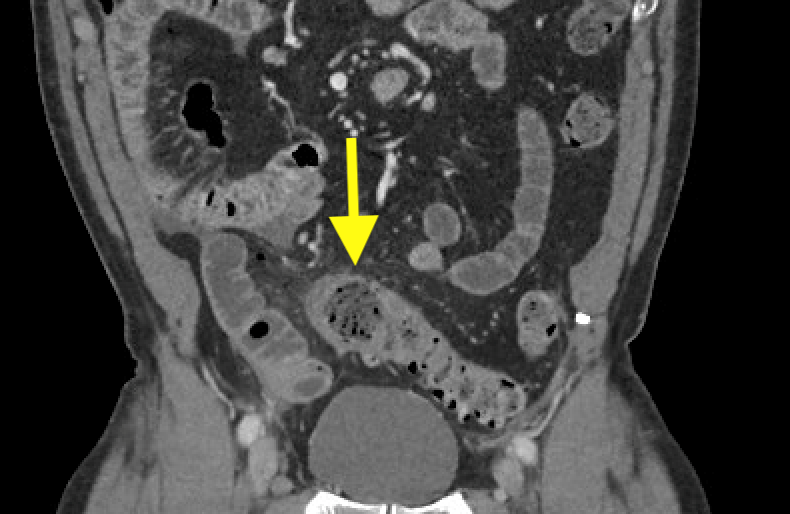
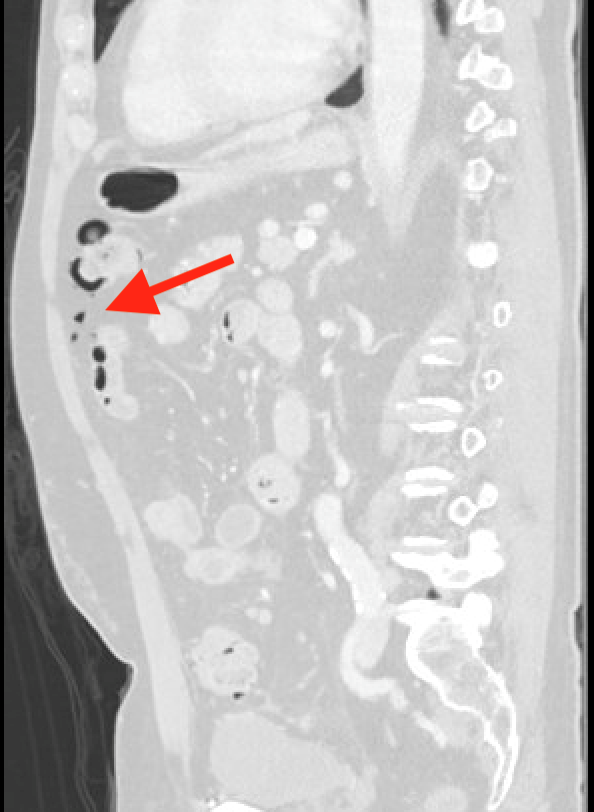
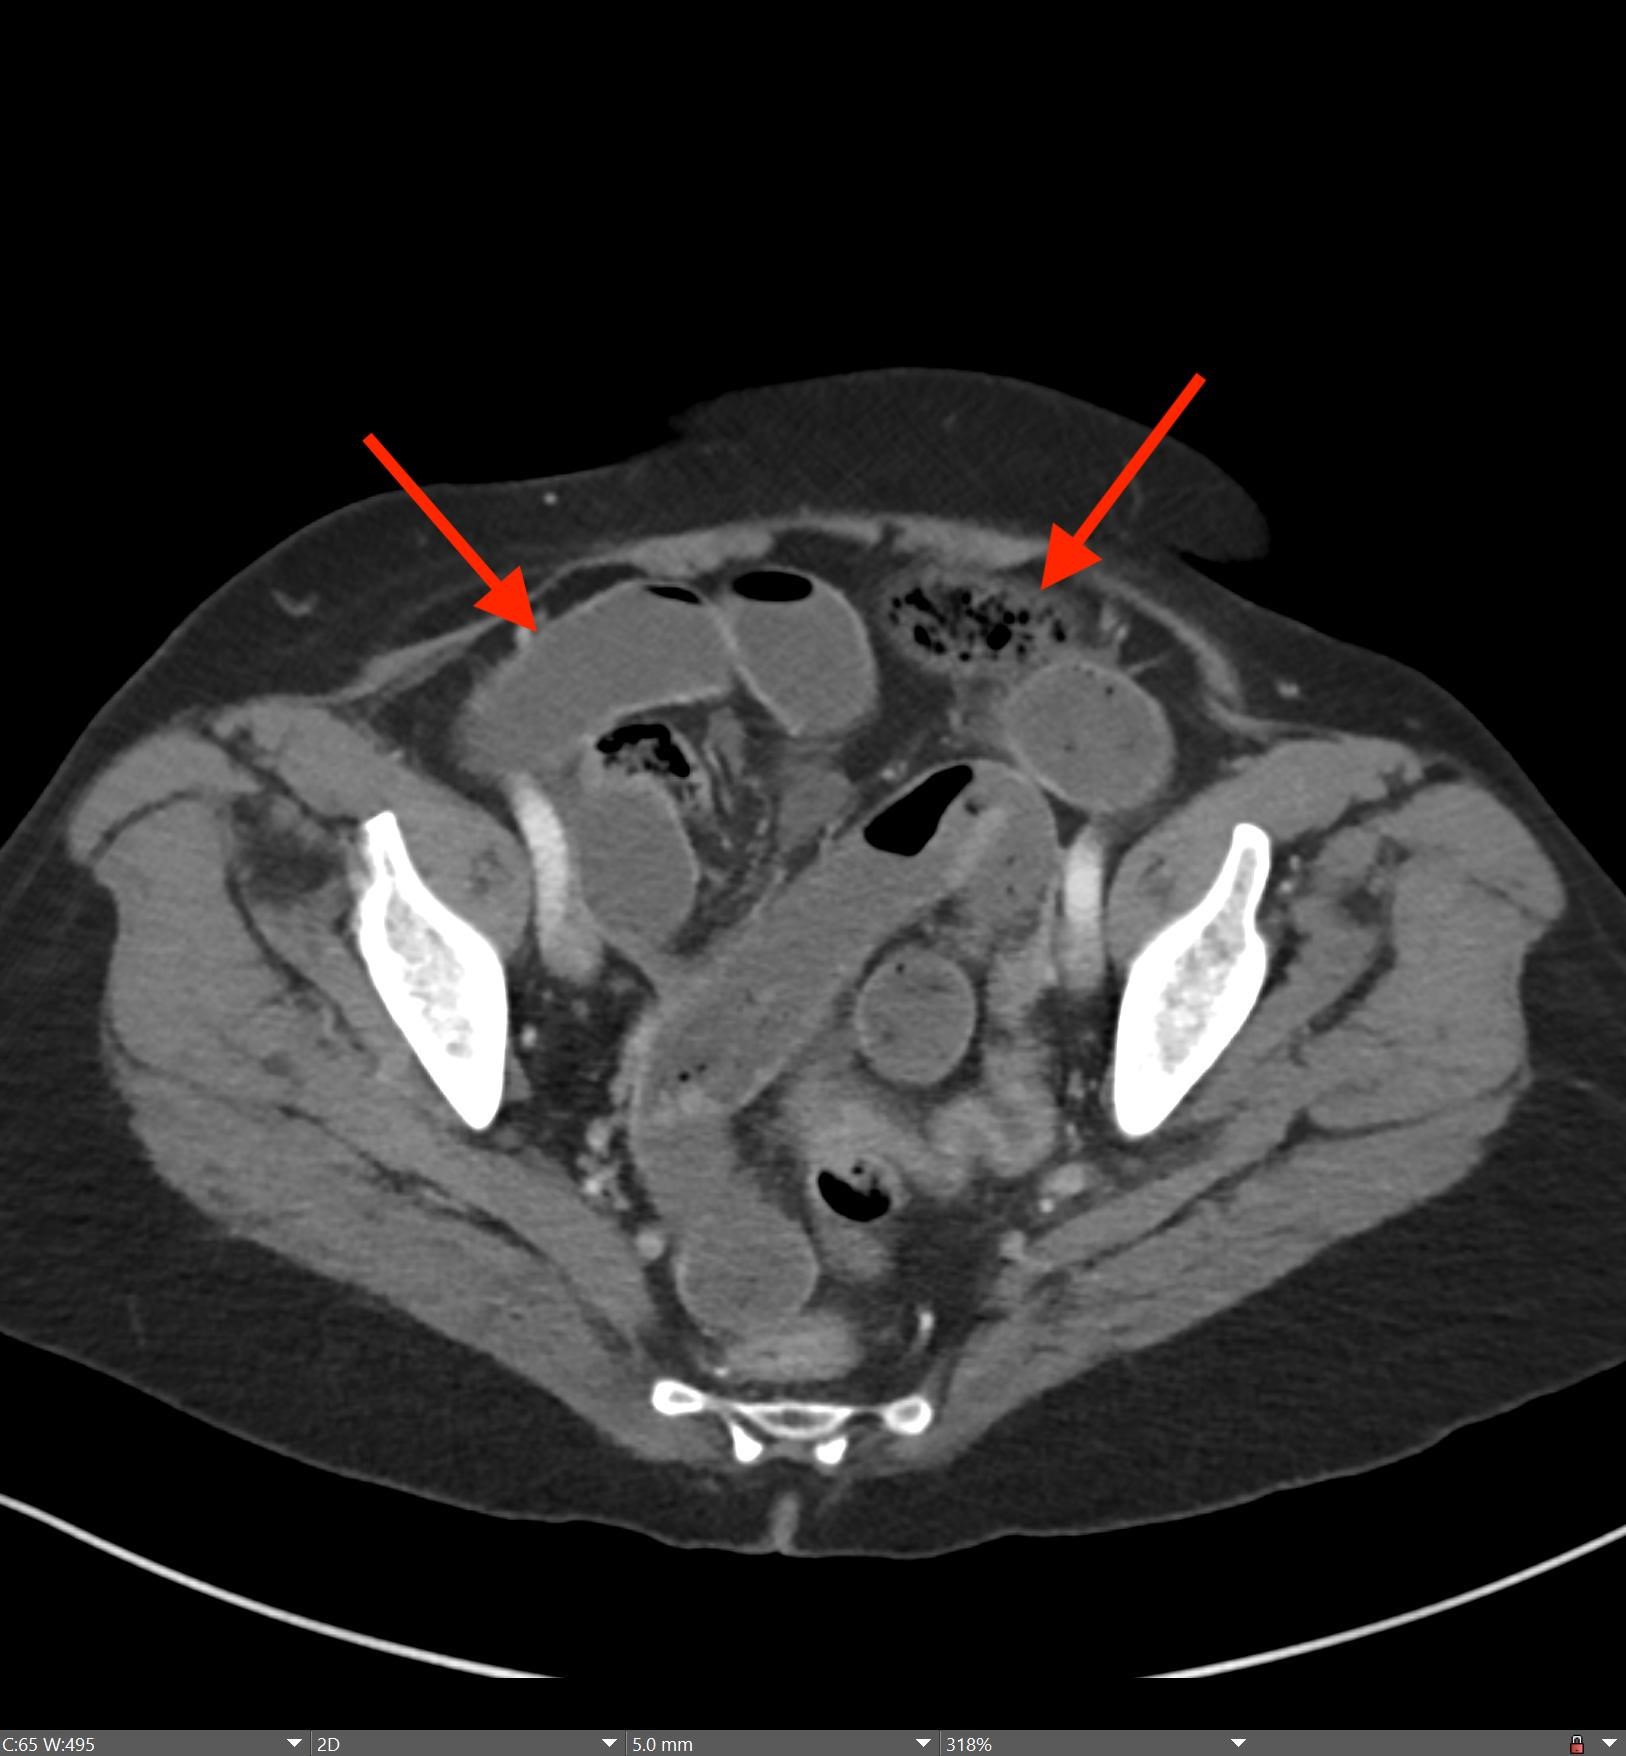
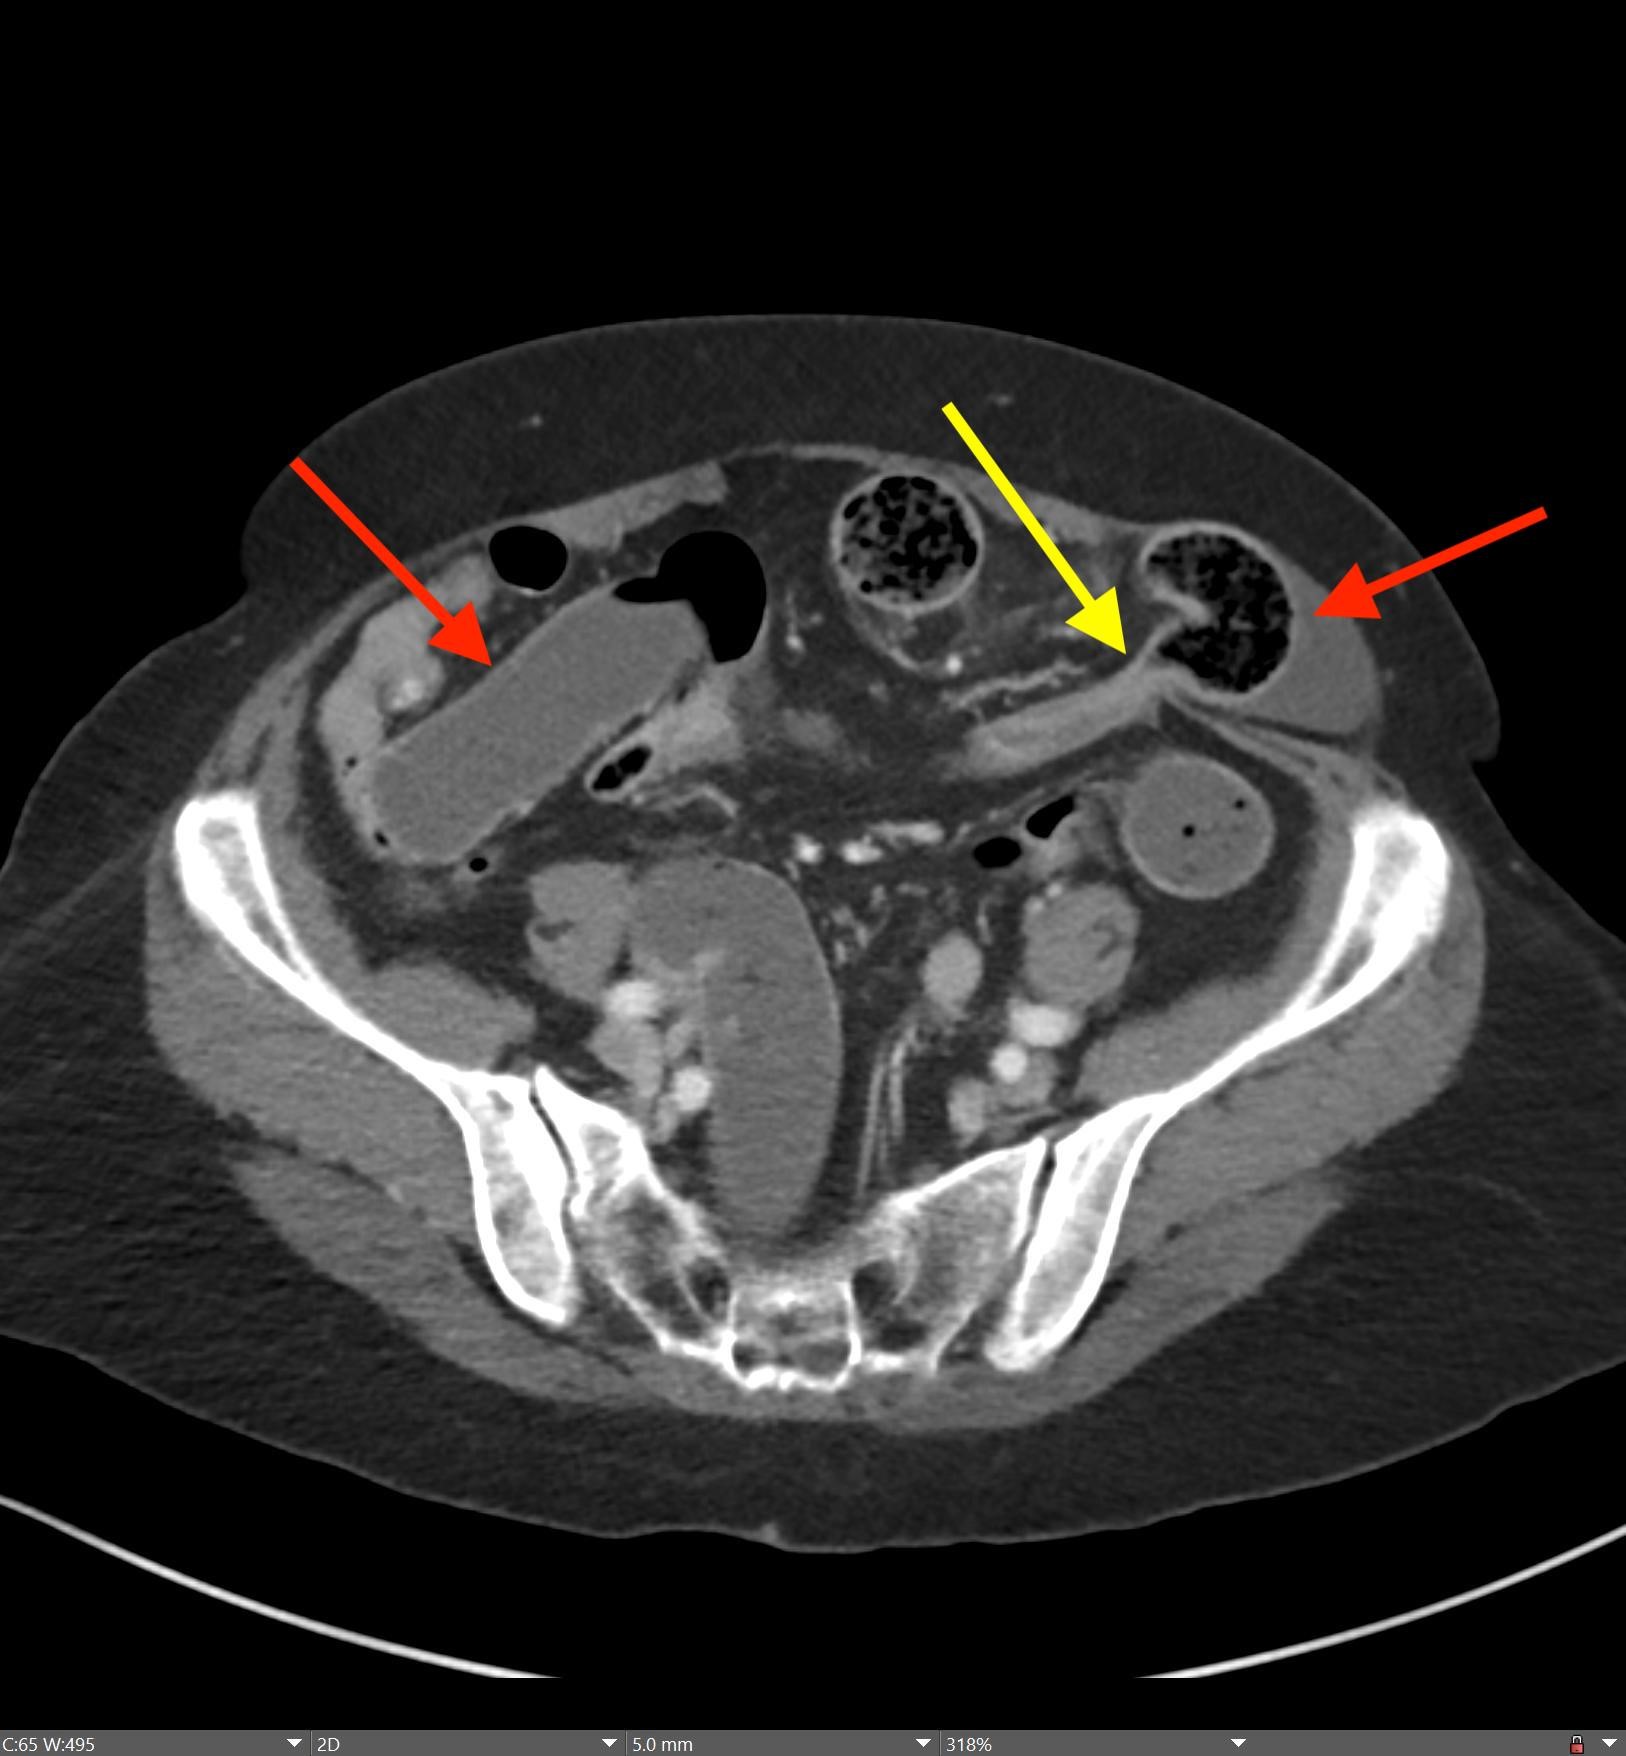
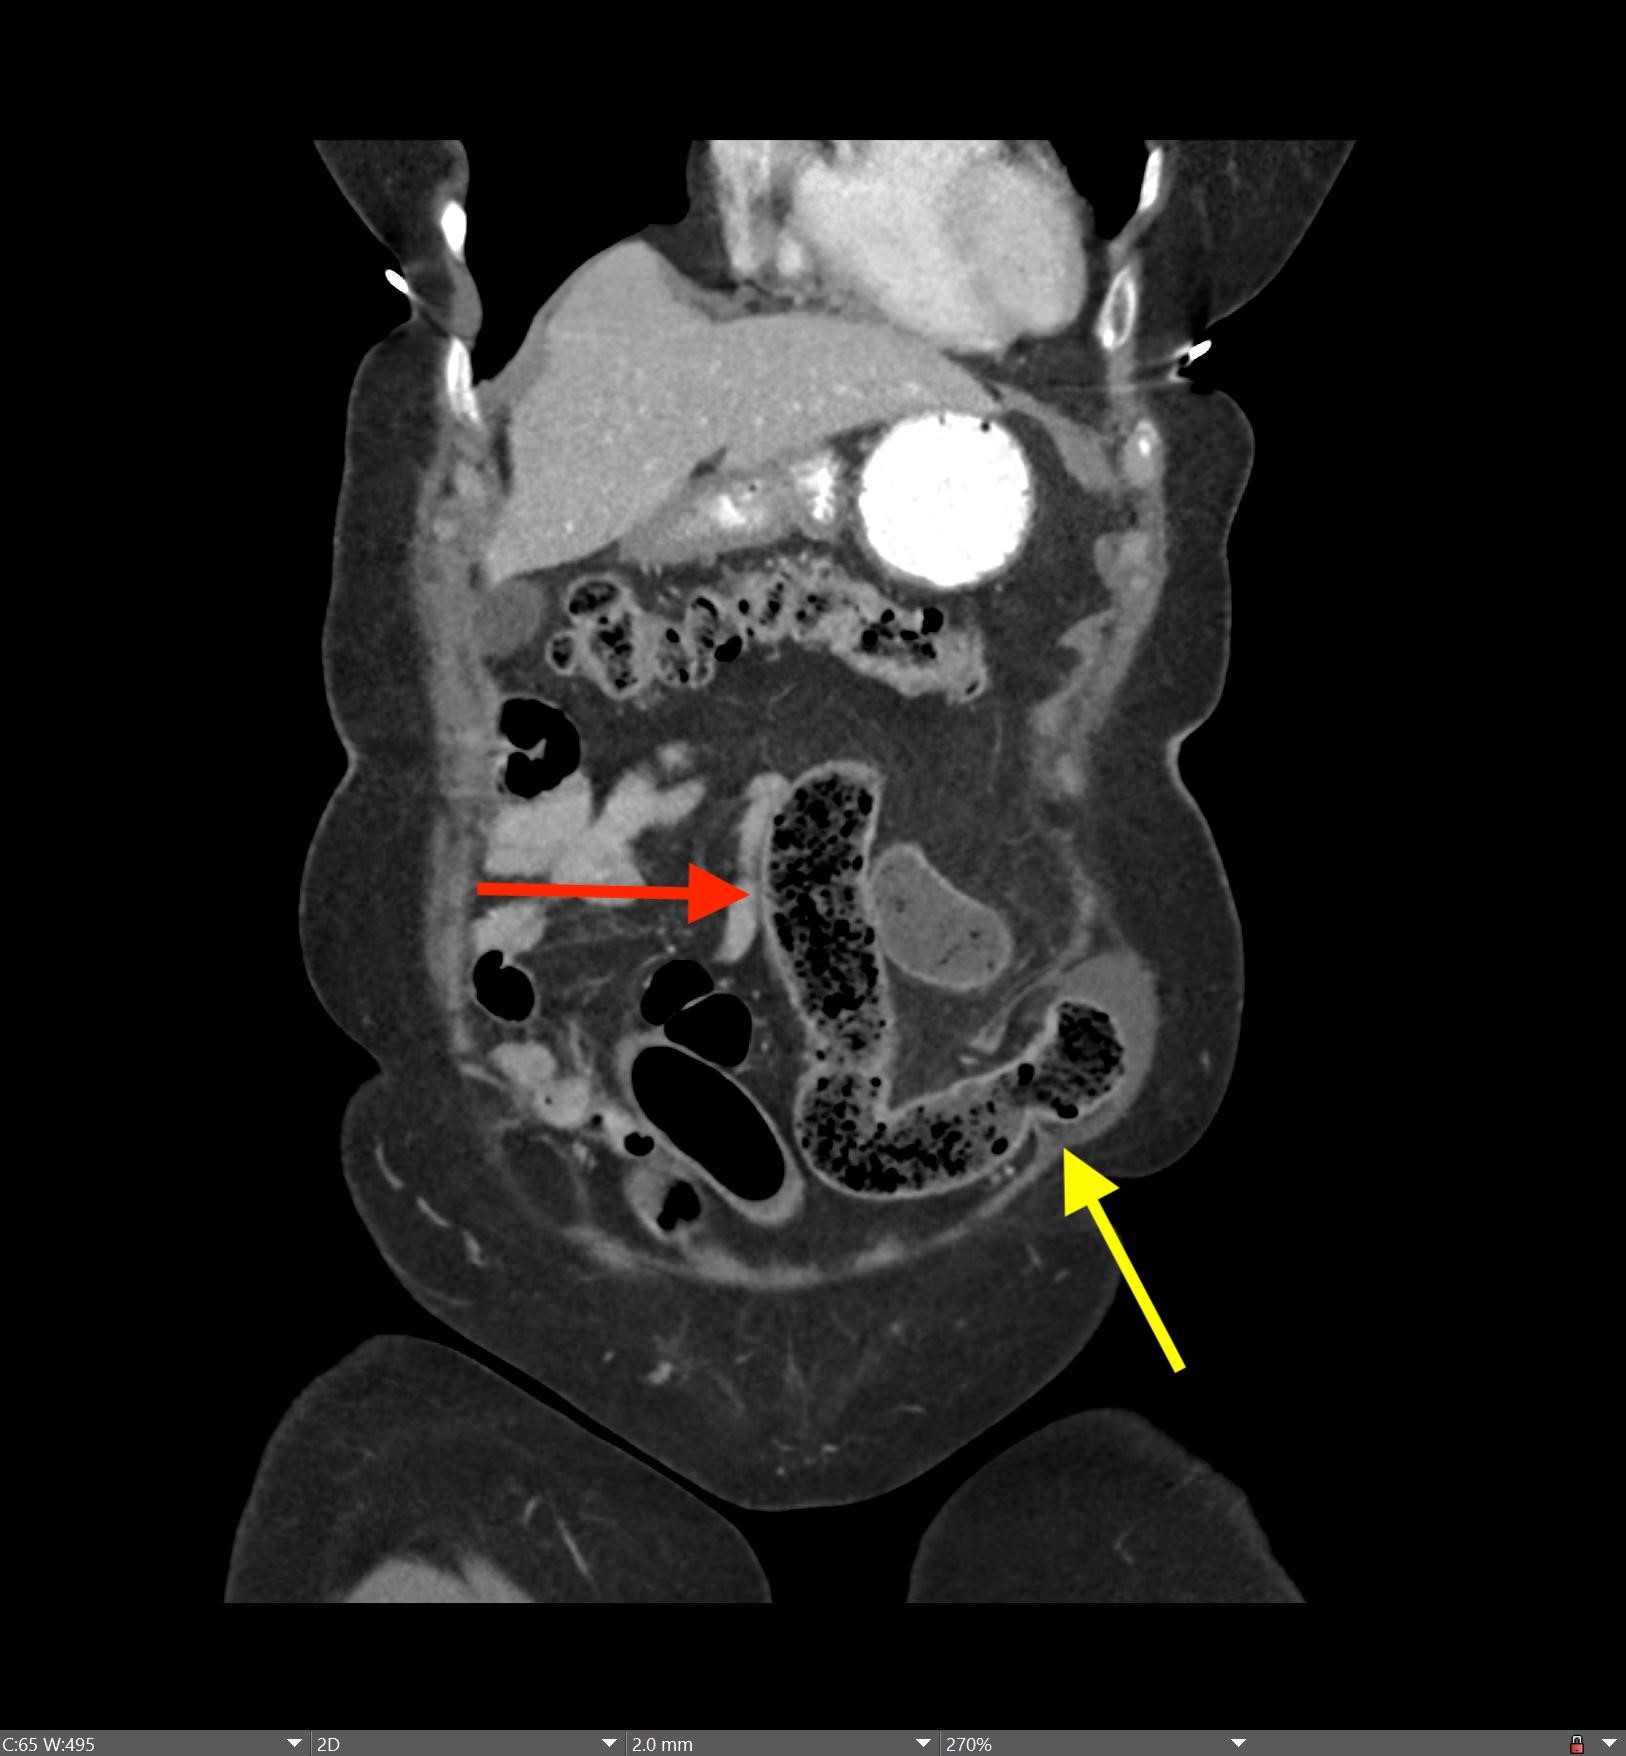
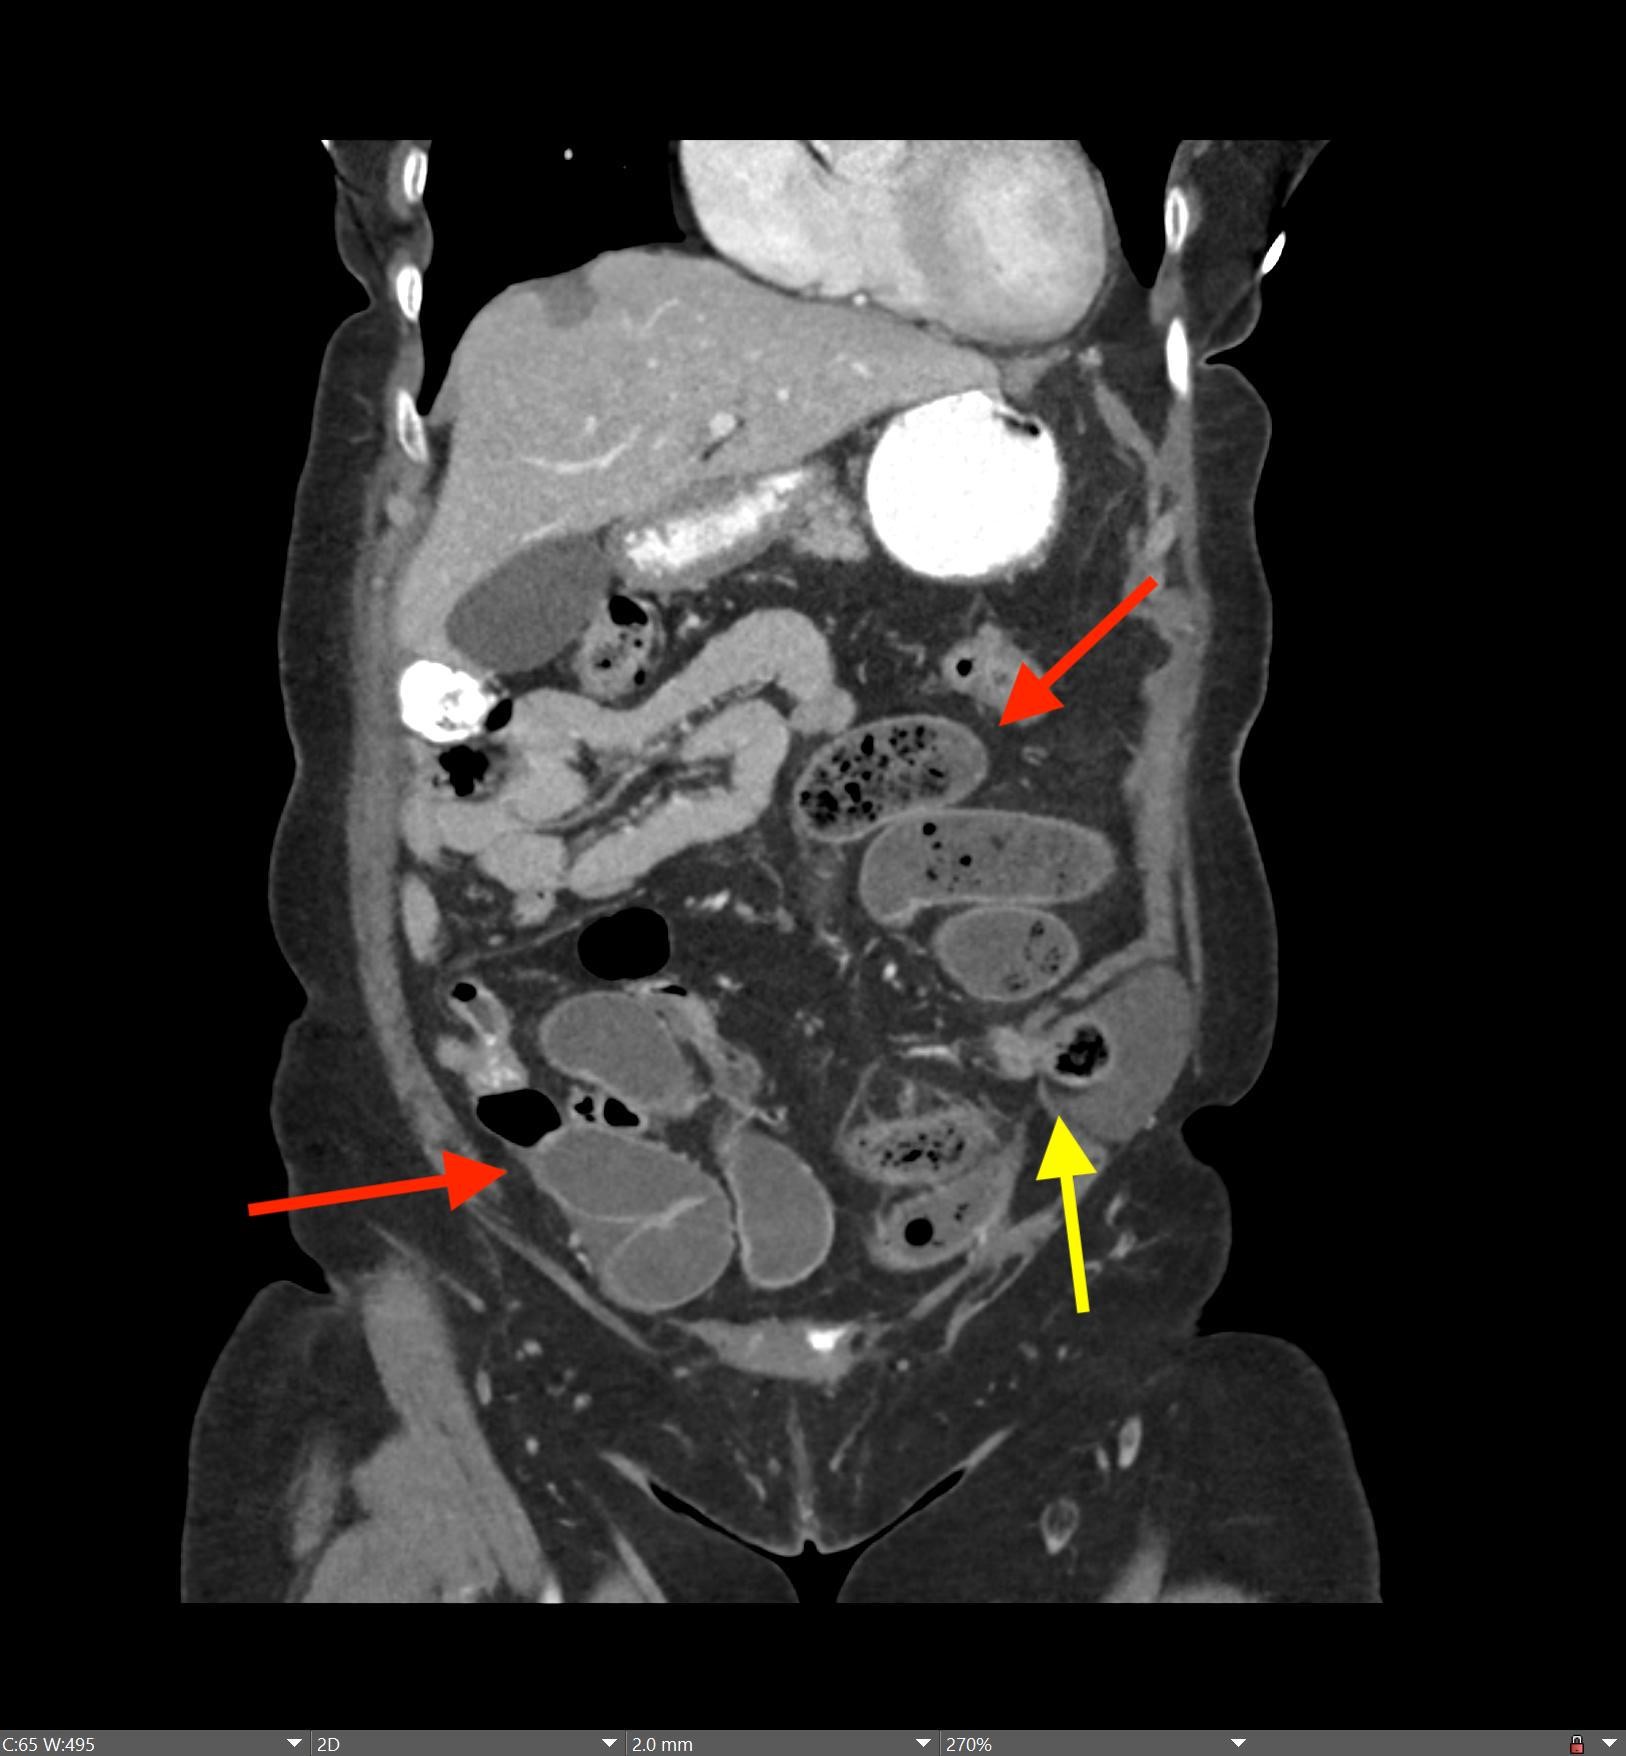
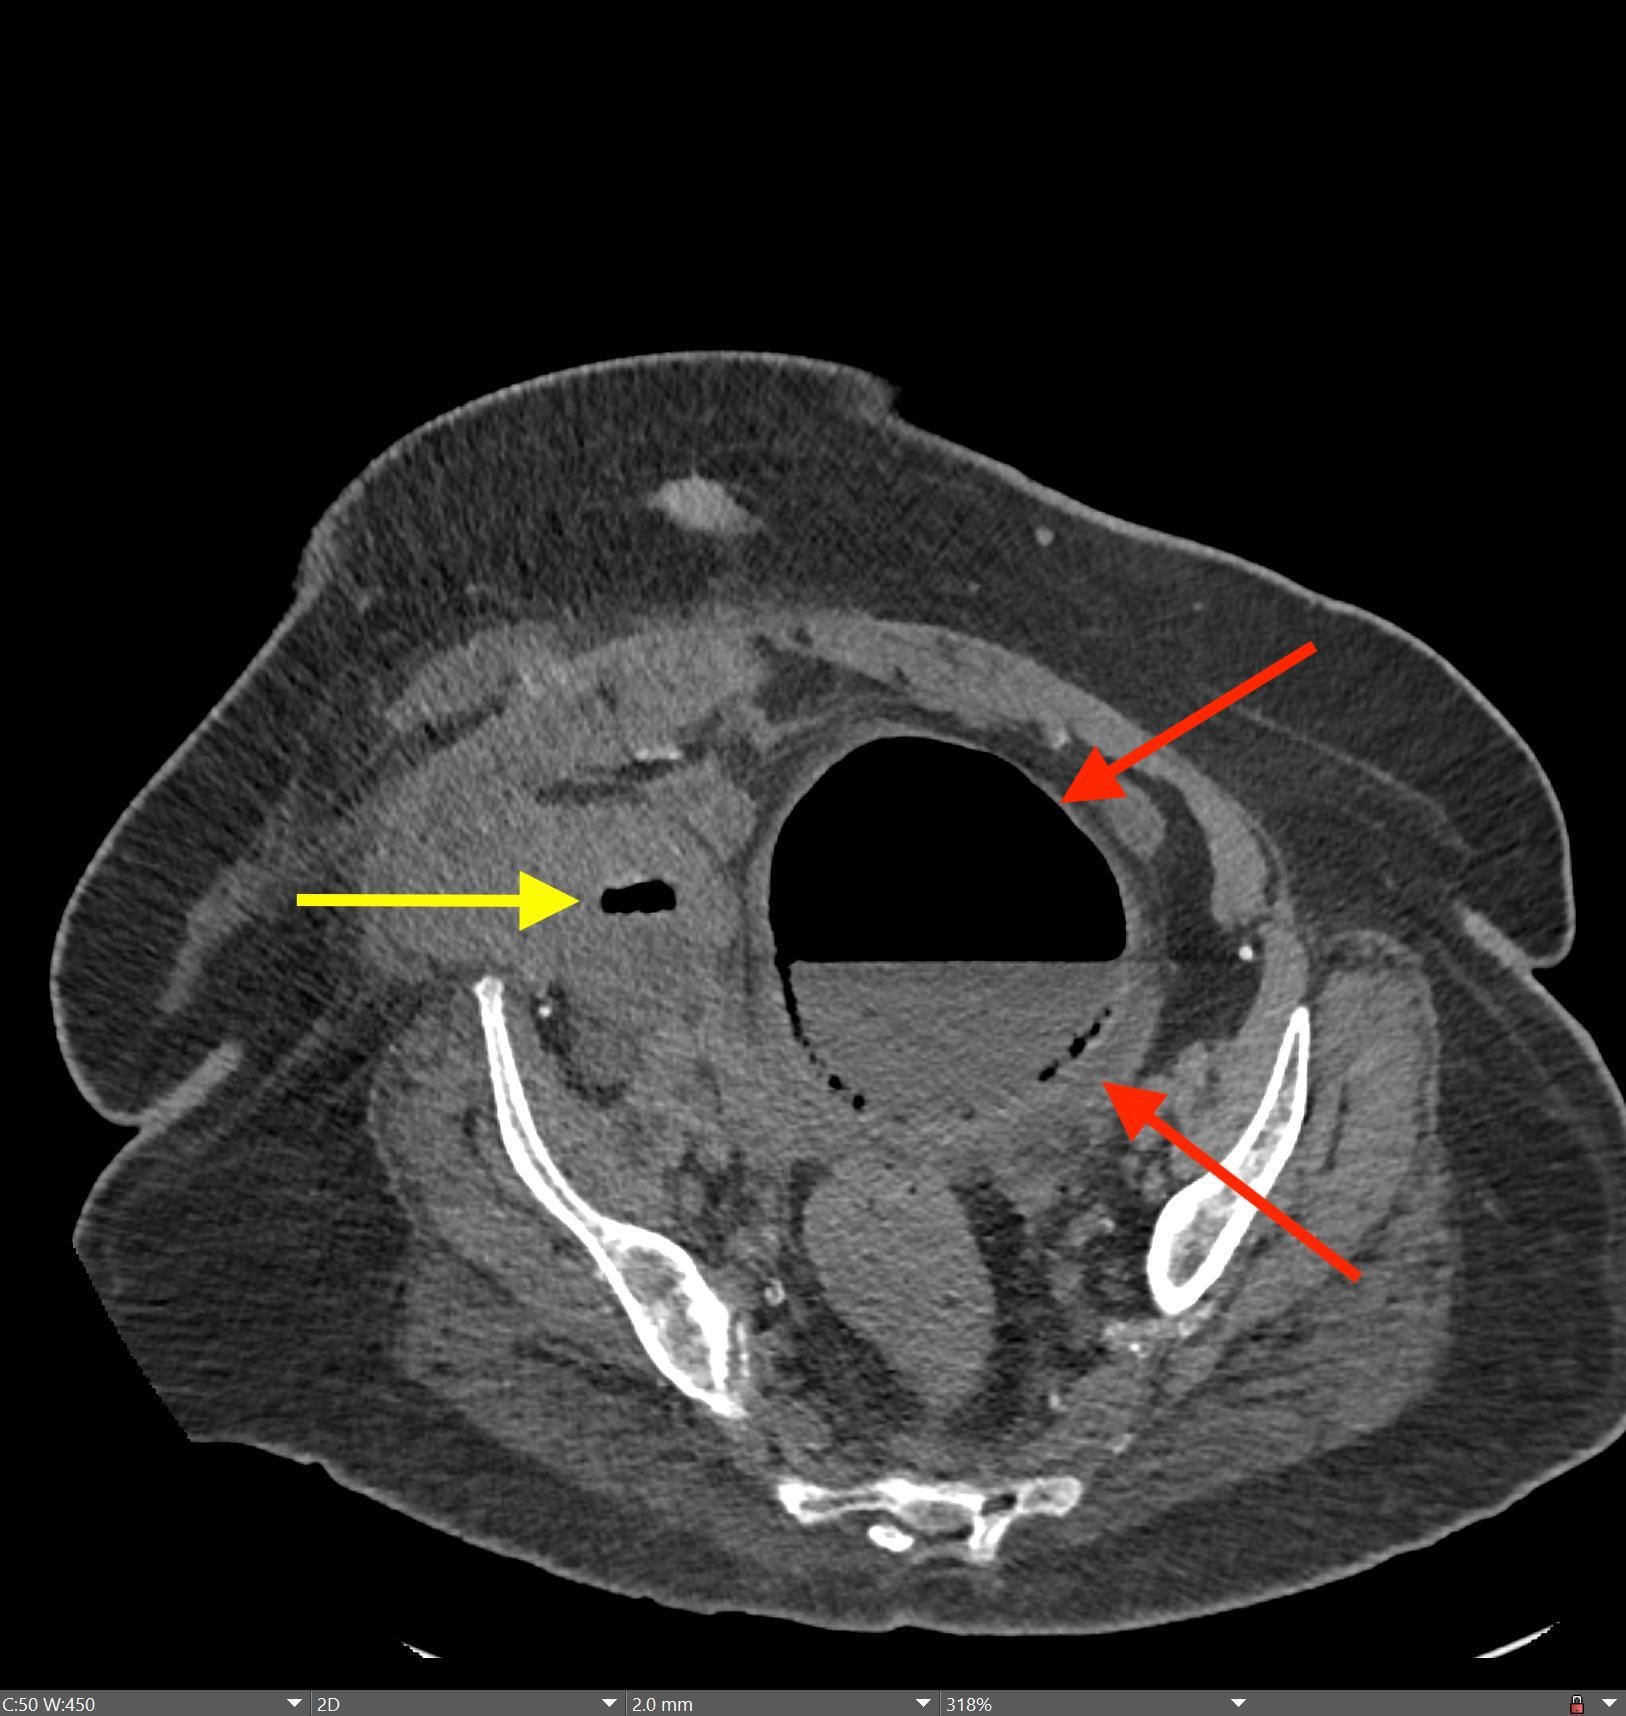
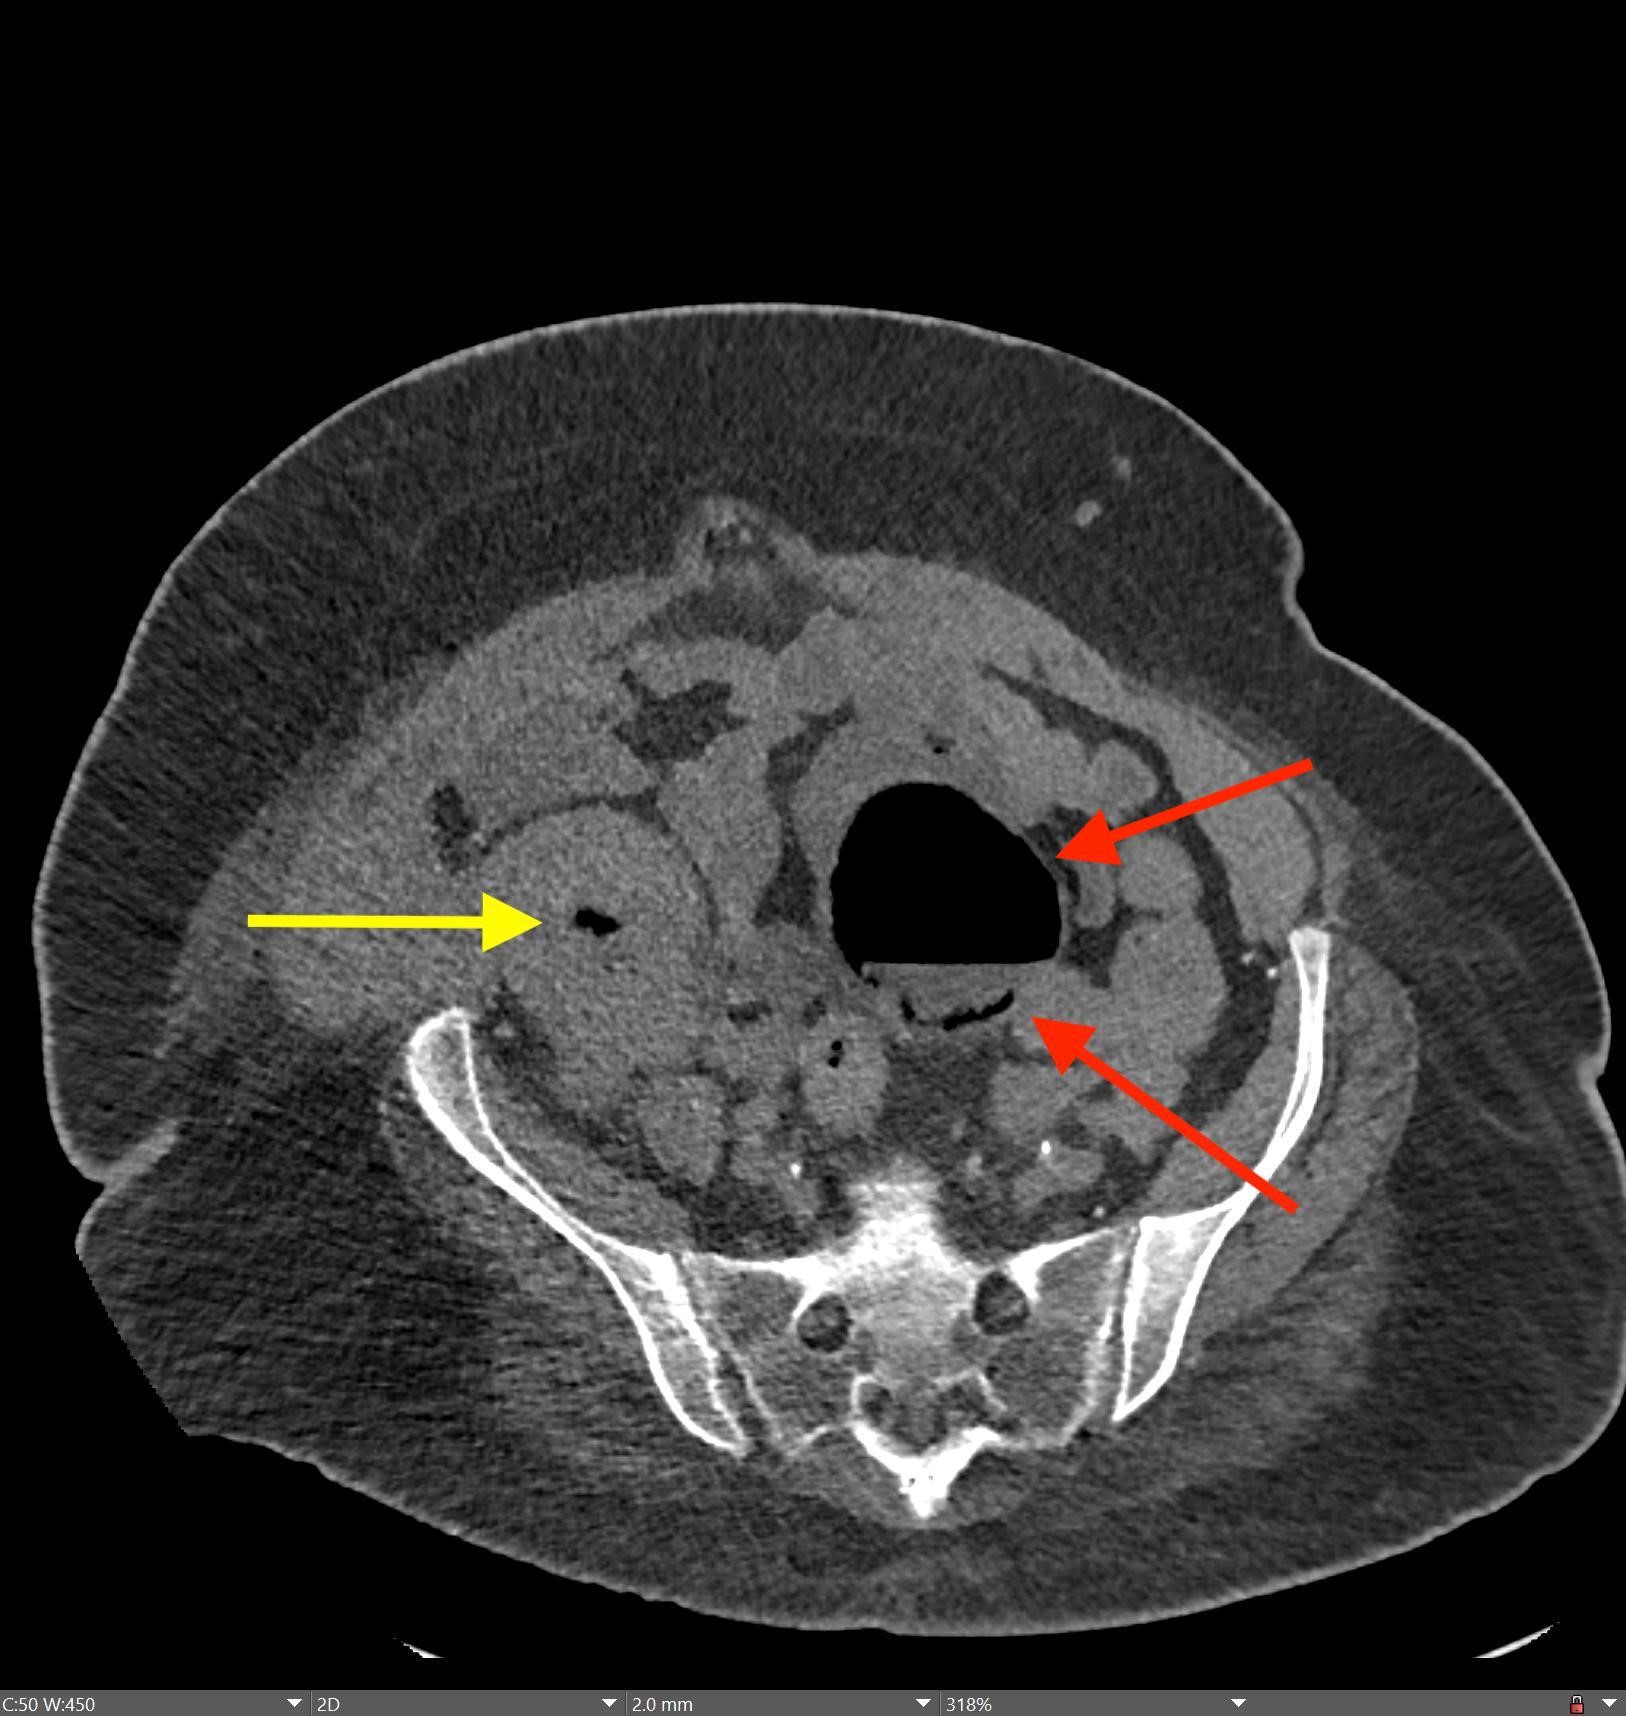
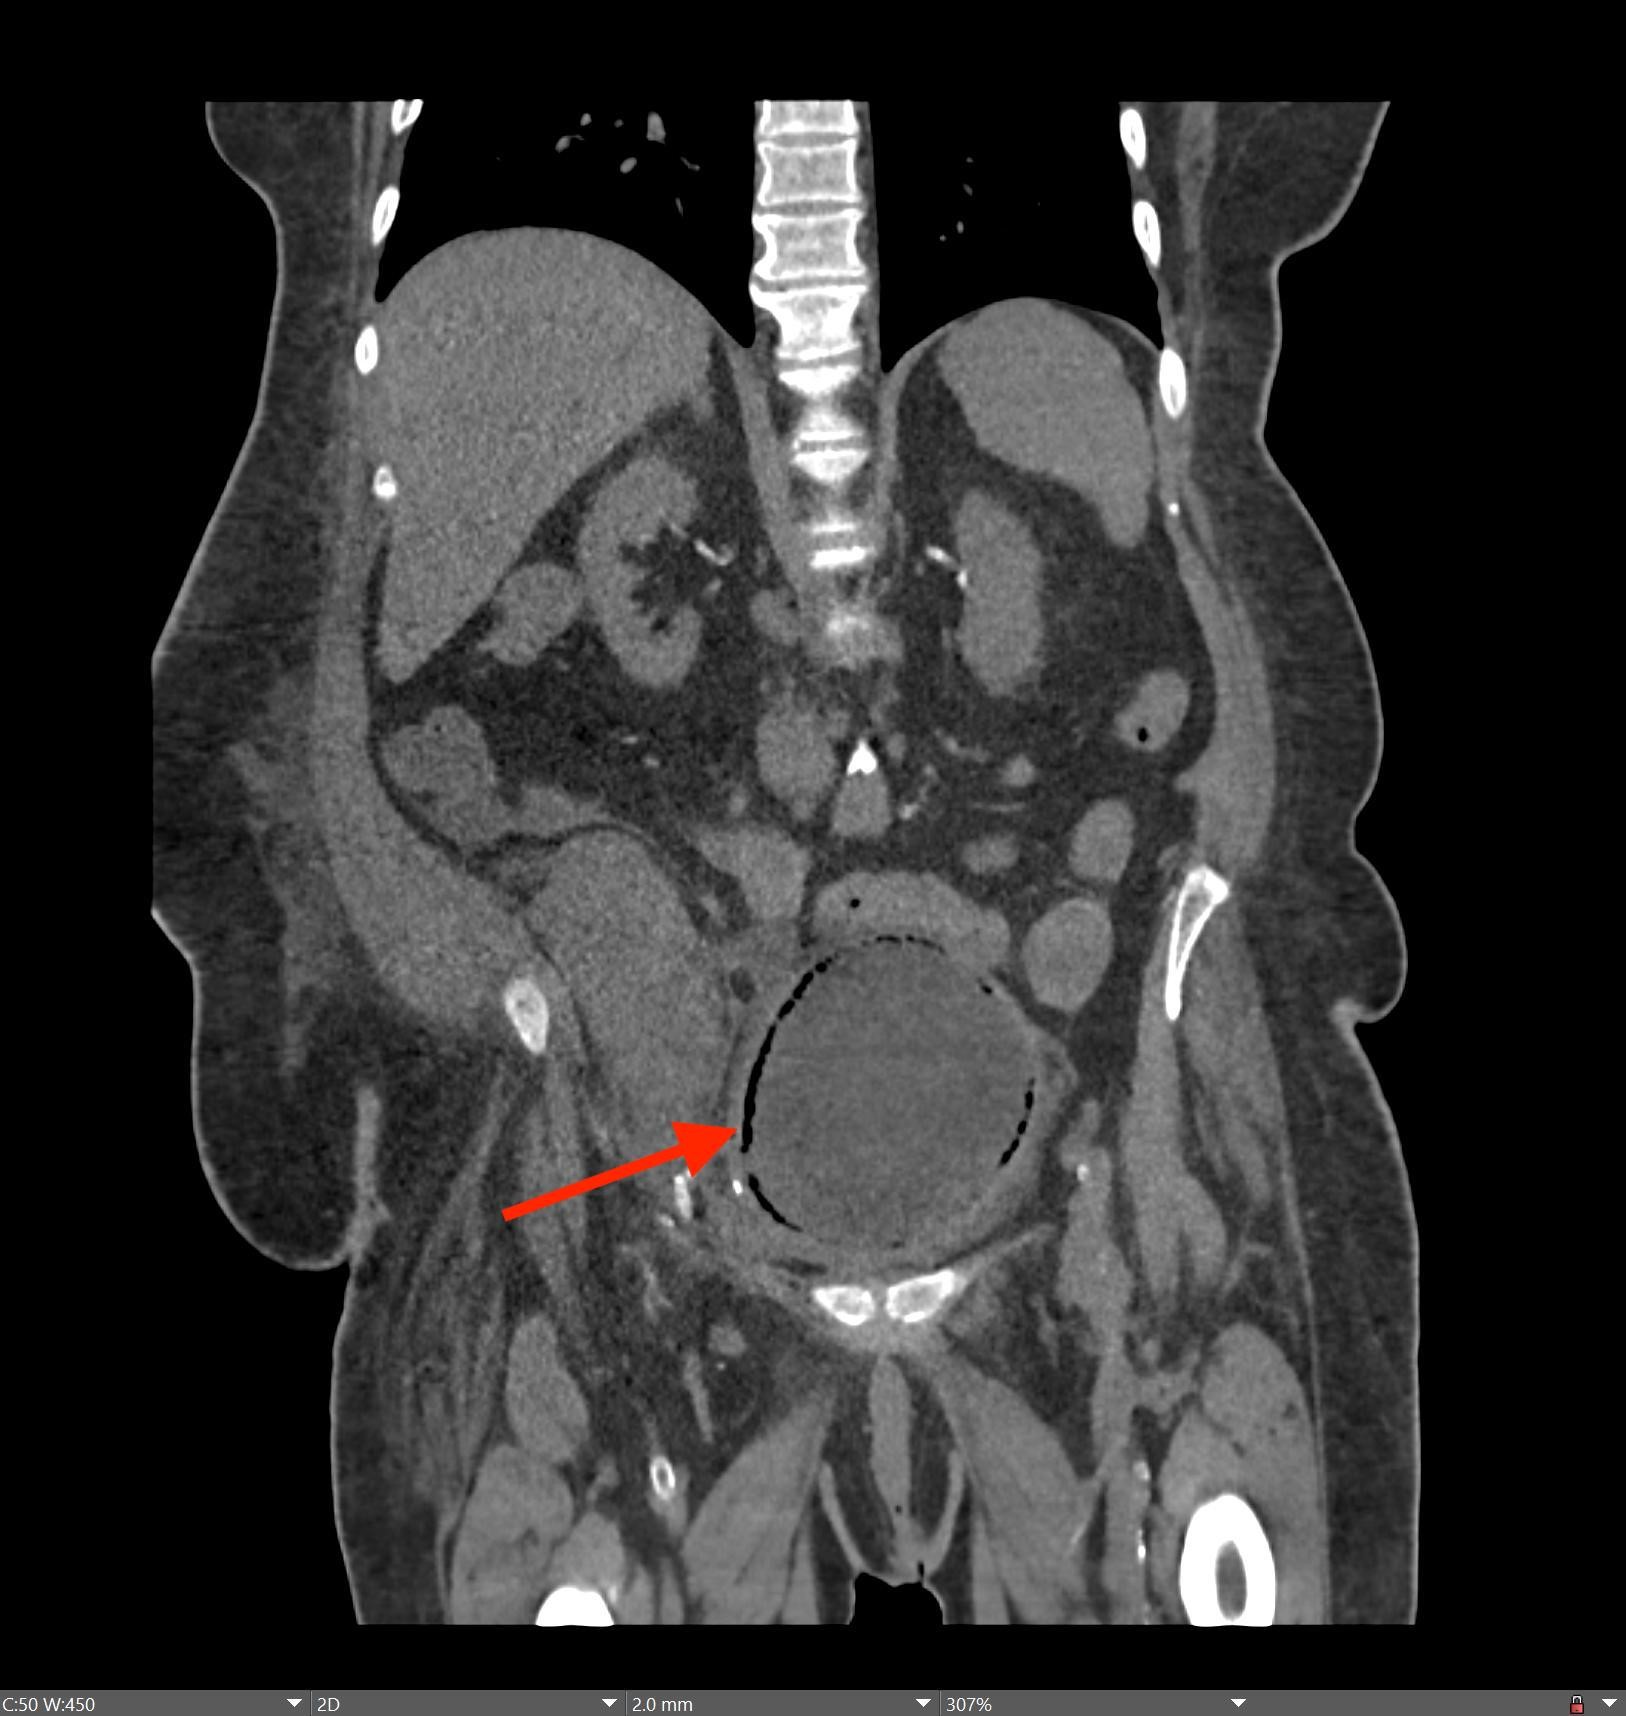
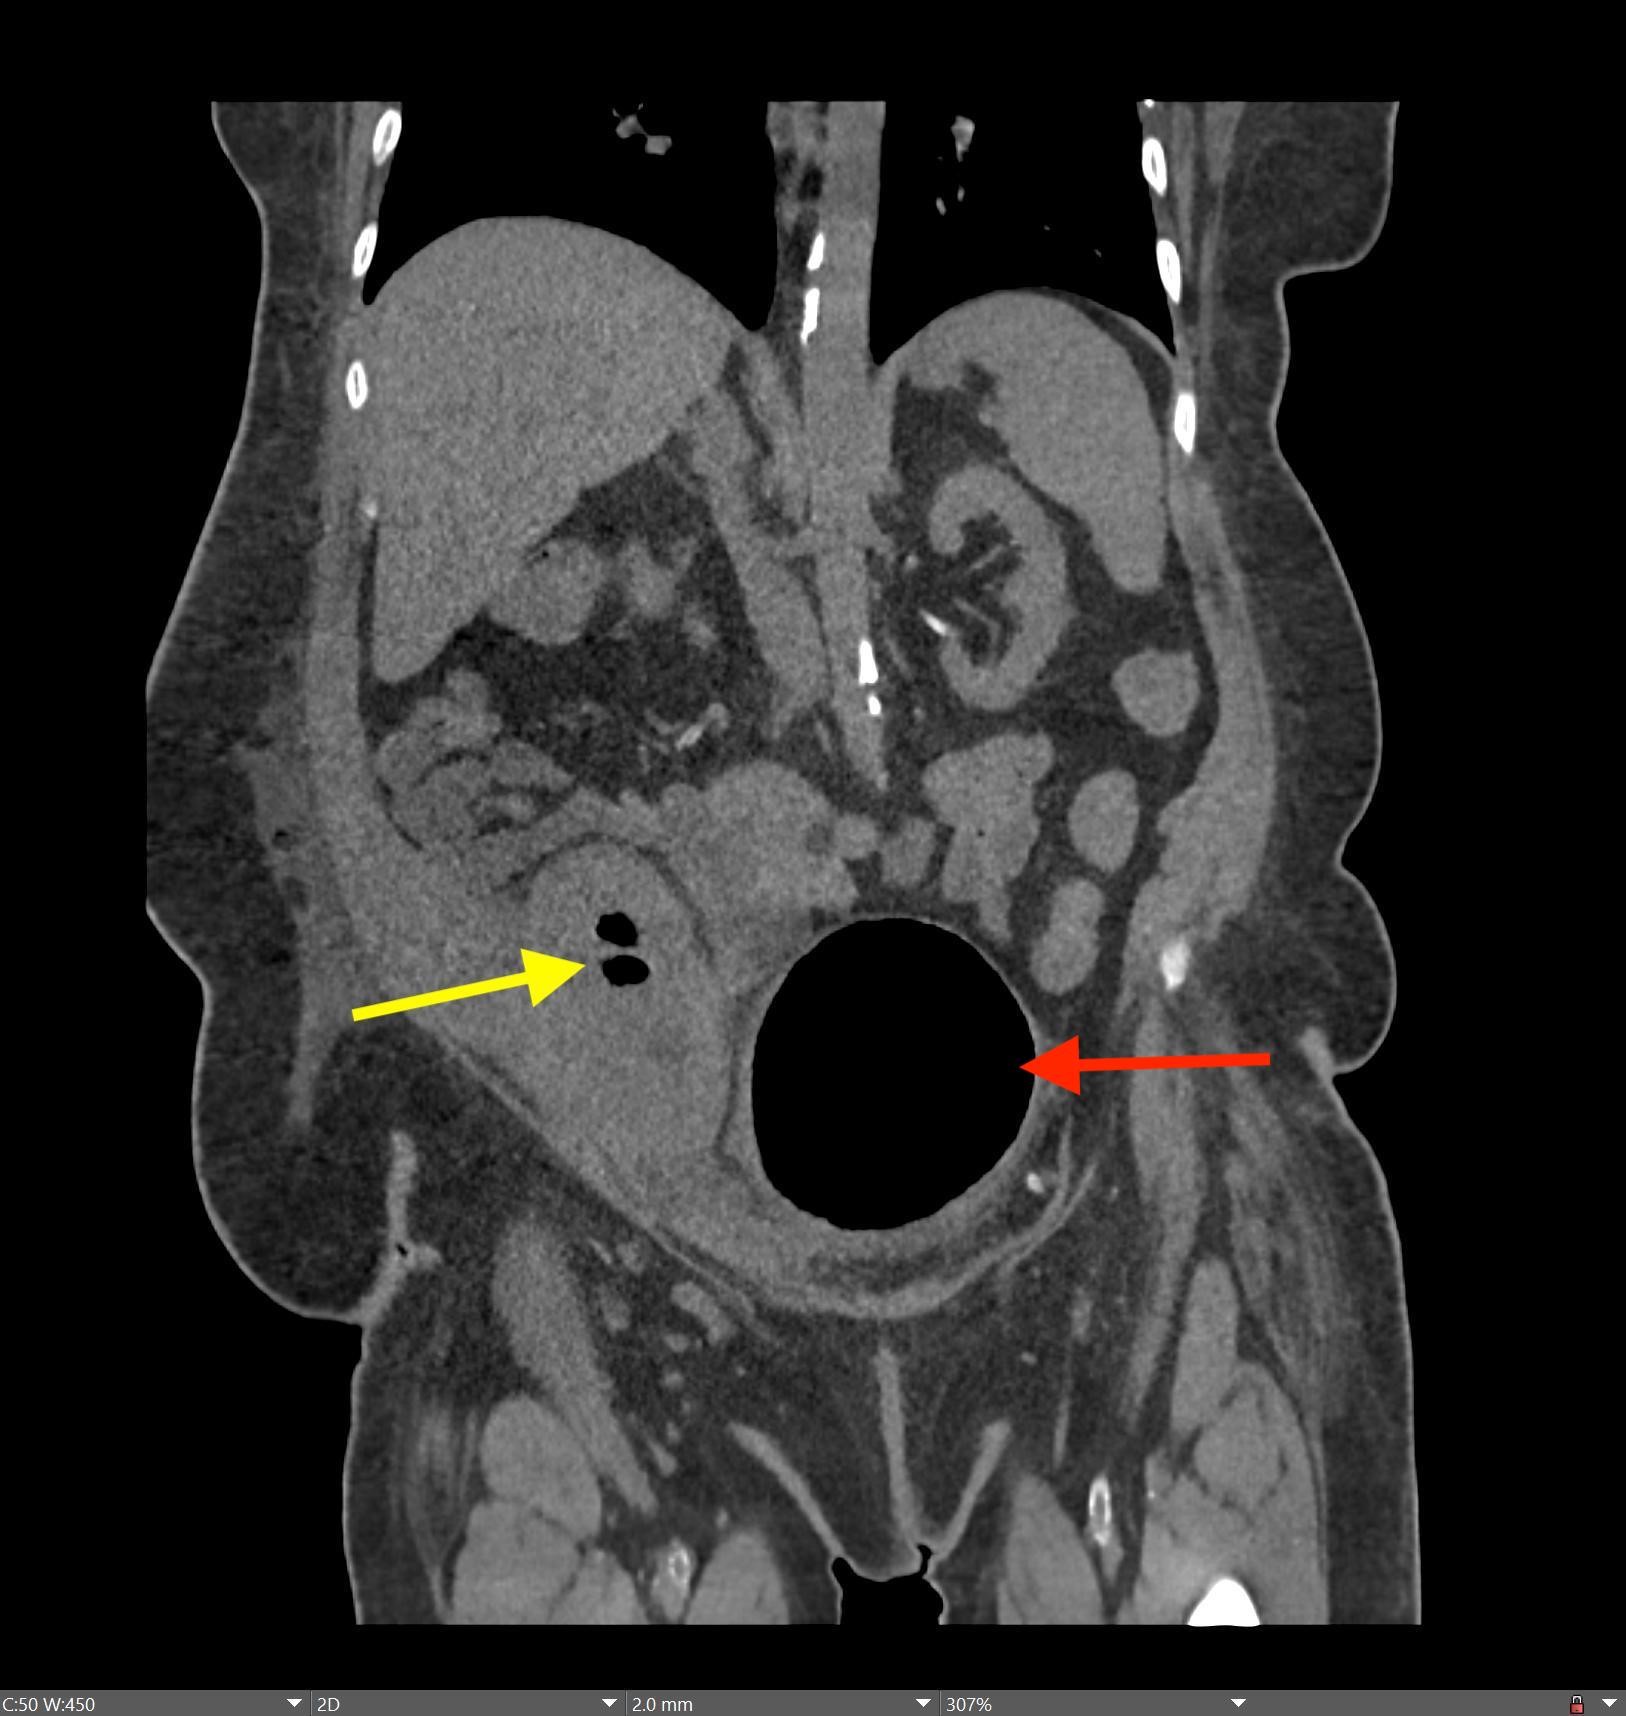
Imaging Findings: Contrast enhanced CT of the abdomen and pelvis reveals multiple loops of hypoenhancing small bowel in the lower abdomen compatible with traumatic devascularization. There is contusion in the flanks and anterior abdominal wall. There is free fluid surrounding several loops of small bowel providing additional evidence of traumatic bowel injury. There is extraluminal fecal material adjacent to a focal discontinuity in the wall of the transverse colon compatible with traumatic colonic perforation.
Diagnosis: Traumatic small bowel devascularization and transverse colon perforation.
Course: The patient was taken emergently to the operating room for exploratory laparotomy. Blood clots and stool were present upon entry into the abdomen. There were multiple small bowel mesentery bucket handle tears with ischemic loops of jejunum and ileum. There was an ischemic and perforated segment of the mid transverse colon. Abdominal washout and resection of injured small bowel and colon was performed with formation of a diverting ostomy. The patient had a lengthy post-operative course but survived.
Discussion: Evidence of traumatic bowel injury on imaging almost always necessitates operative exploration. Blunt trauma can result in shear injuries at sites of bowel fixation, such as the ligament of Treitz or adhesions in patients with prior abdominal surgeries. Blunt trauma can also result in crush injuries as the bowel is compressed between the spine/pelvic bones and external objects such as a bike handlebar or steering wheel. Small bowel is more commonly injured than large bowel in the setting of blunt trauma. The presence of a seatbelt sign on exam significantly raises probability bowel injury. Patients with severe abdominal injuries are typically left with an open abdomen and will be taken back to the OR for definitive management after resuscitation and medical stabilization in the intensive care unit.
October 2024: Traumatic Aortic Injury
History: A young adult male is brought to the emergency department by EMS after a motorcycle accident. The patient was sedated and intubated in the field. The patient was hemodynamically stable upon arrival and then taken for cross-sectional imaging after the initial trauma survey.
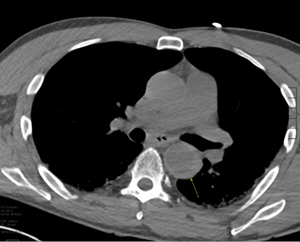
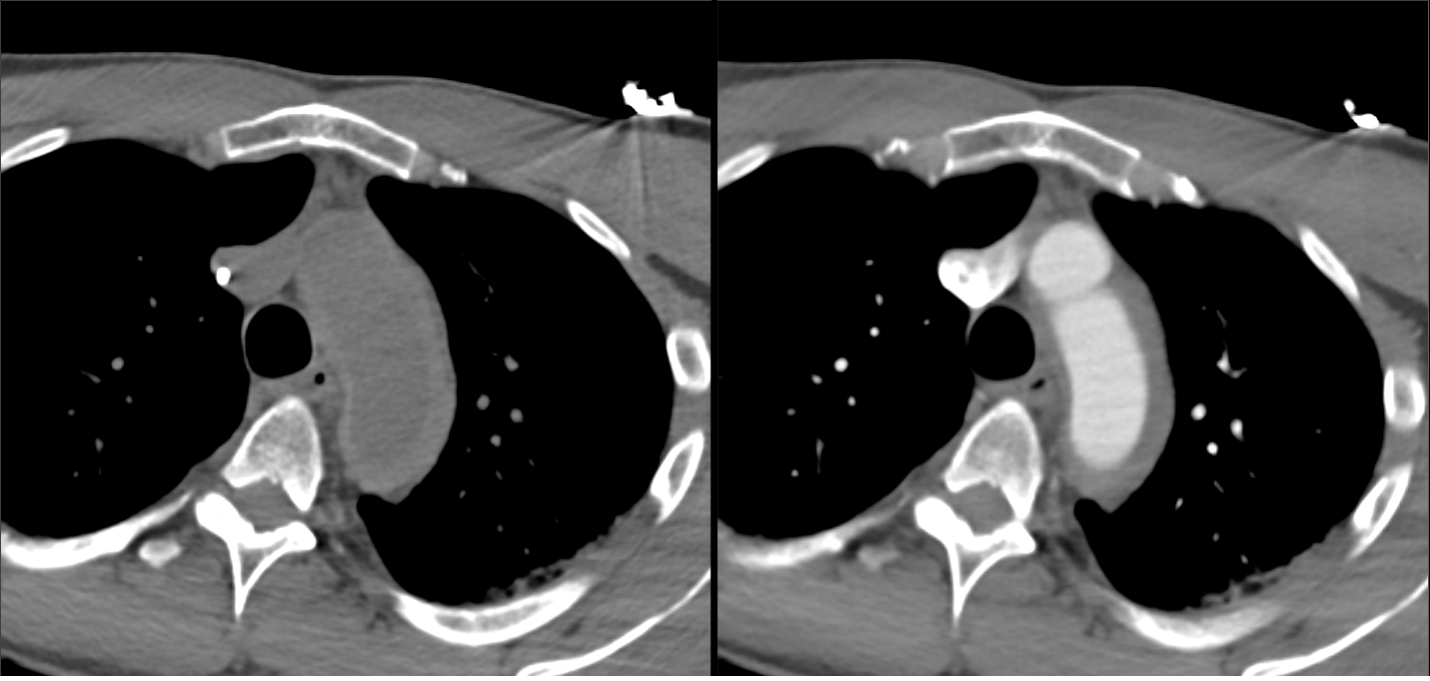
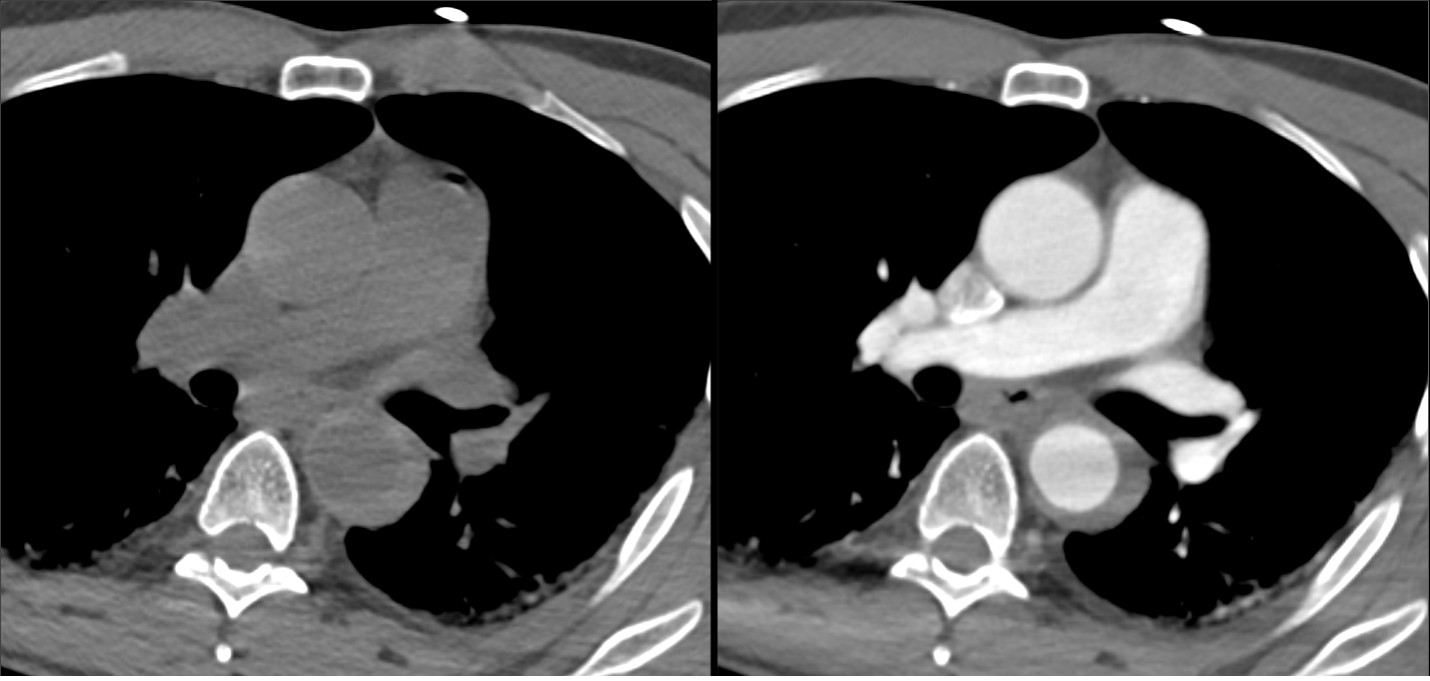
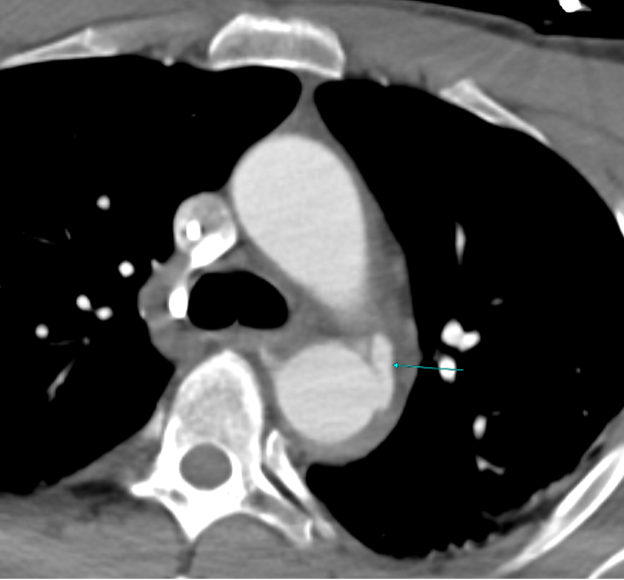
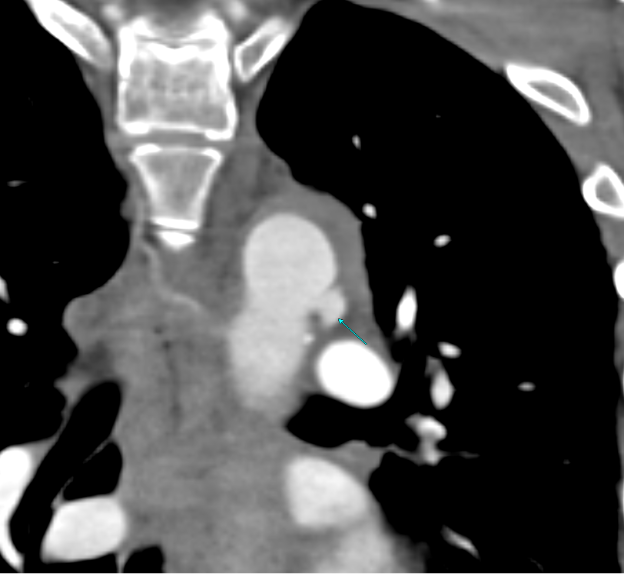
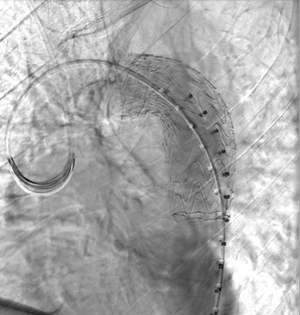
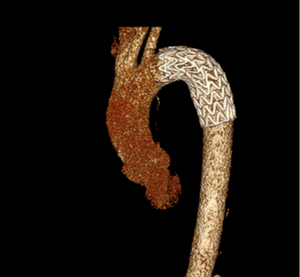
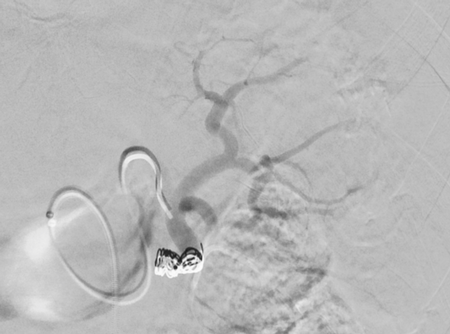
Imaging Findings: Pre-contrast CT of the chest reveals crescentic hyperdensity in the aortic wall beginning distal to the arch great vessels compatible with intramural hematoma (yellow arrow). Post contrast imaging demonstrates an irregular outpouching arising from the thoracic aorta at the level of the aortic isthmus compatible with a pseudoaneurysm (blue arrows). Intra-operative imaging during thoracic endovascular aortic repair (TEVAR) shows a stent graft deployed over the aortic arch distal to the takeoff of the left subclavian artery. Follow up chest CTA reconstruction shows the appropriately positioned graft without opacification of the pseudoaneurysm.
Diagnosis: Traumatic aortic pseudoaneurysm and intramural hematoma.
Course: The patient was taken emergently to the operating room for thoracic endovascular aortic repair (TEVAR) via left common femoral artery access. A stent graft was deployed covering the site of aortic injury. There was no evidence of endoleak on completion angiogram. The patient had an uneventful post-operative course and was discharged shortly thereafter. A follow up CT angiogram performed several months later showed no evidence of endoleak or surgical complication.
Discussion: Aortic trauma is a life-threatening injury which requires prompt diagnosis and intervention for survival. An estimated 85-90% of patients with these injuries will die in the field before they can be brought to the nearest hospital. Traumatic aortic injuries can include intimal tears, intramural hematoma, pseudoaneurysm, to complete transection of the aortic wall. Medical management includes impulse control with intravenous beta-blockers such as esmolol to reduce stress and shear on the aortic wall. Endovascular stent grafting is the preferred option for surgical intervention. Patients with unfavorable anatomy or extensive injuries may need open surgical repair which carries a higher risk of complication and longer recovery time.
September 2024: Osteonecrosis of the Femur
History: A young adult male presents with chronic right groin pain which exacerbates with activity. Hip range of motion was limited on physical exam. Imaging of the right hip was obtained.
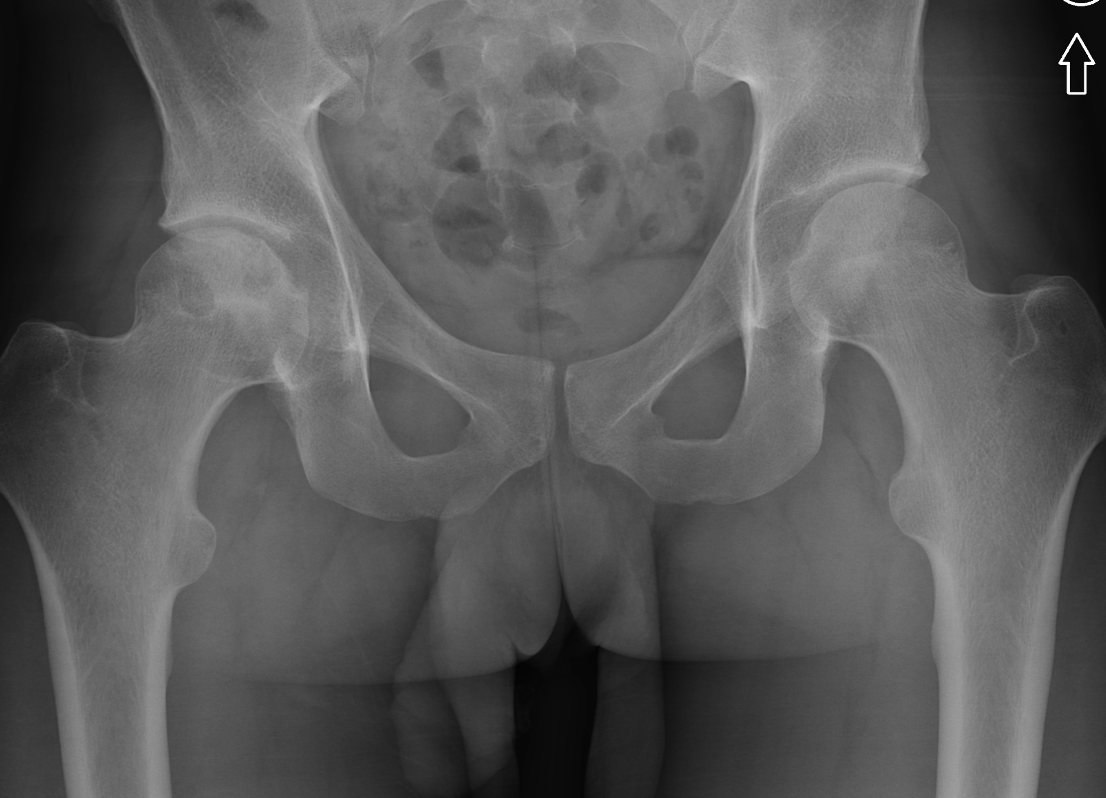
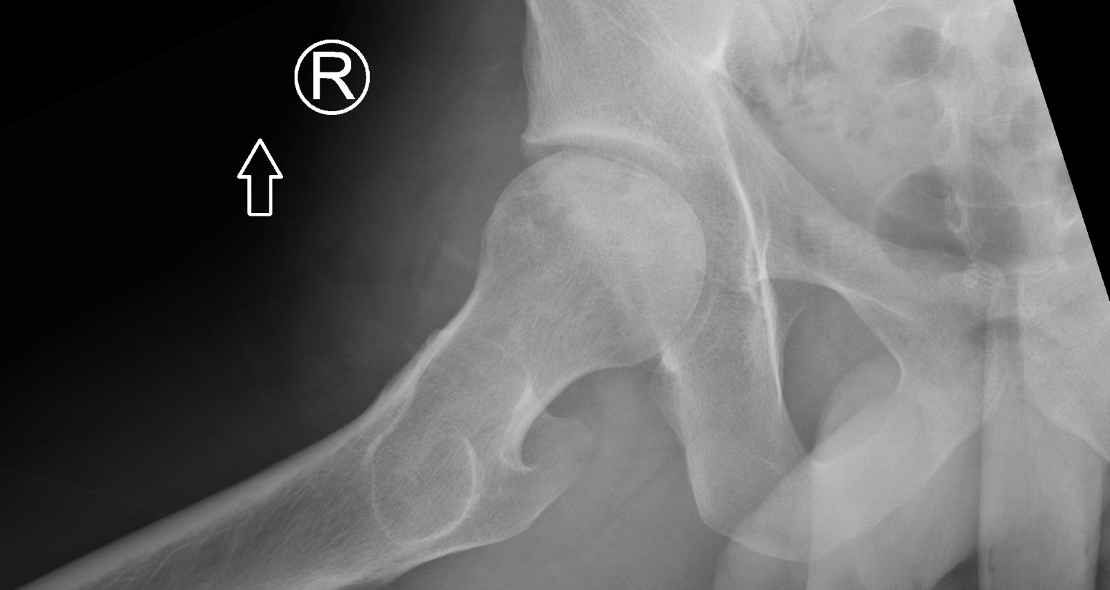
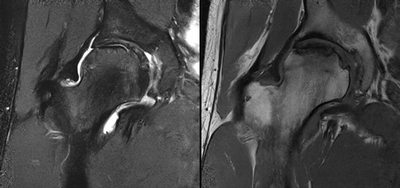
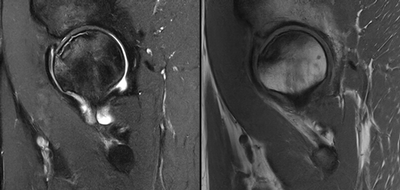
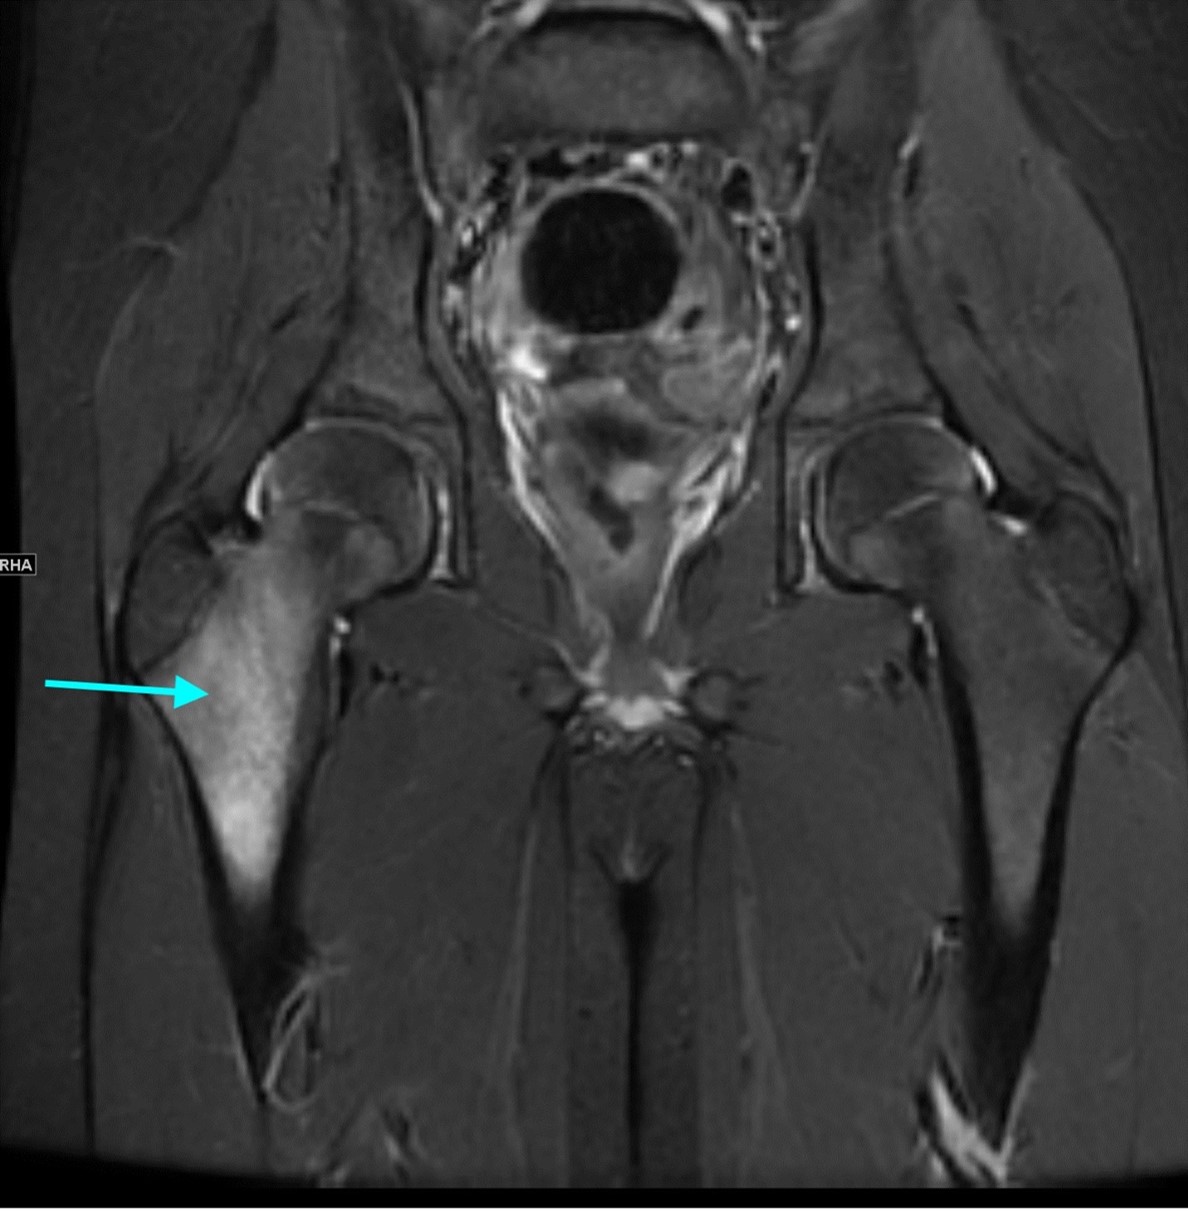
Imaging Findings: AP and lateral radiographs of the right hip reveals femoral head collapse and sclerosis with subchondral crescentic lucency. Follow up MRI confirms the findings of femoral head articular surface collapse with a curvilinear stripe of subchondral marrow edema demarcating the edematous and viable marrow from the necrotic, sclerosed marrow.
Diagnosis: Femoral head osteonecrosis with articular surface collapse
Course: The patient was prescribed physical therapy and as needed anti-inflammatory medication. He was advised that given the advanced stage of osteonecrosis at his young age, he will likely need a hip replacement in the future as the osteonecrosis progresses.
Discussion: Osteonecrosis is the death of bone tissue secondary to lack of blood flow. The condition usually affects the epiphyses of bones. Osteonecrosis has numerous etiologies but in most cases is idiopathic. Femoral head collapse, as seen in this case, is a finding of advanced osteonecrosis which predisposes to early osteoarthritis because the femoral head no longer rotates smoothly within the acetabulum. Initial treatment is generally conservative, however as the condition progresses surgical interventions such as decompressive osteotomy or total hip replacement are indicated.
August 2024: Gout
History: A middle-aged male presents with severe, acute onset lateral foot pain and swelling. On physical examination the first metatarsophalangeal joint was warm, edematous, and tender to palpation. Serum uric acid was elevated. Radiographs of the foot were ordered.
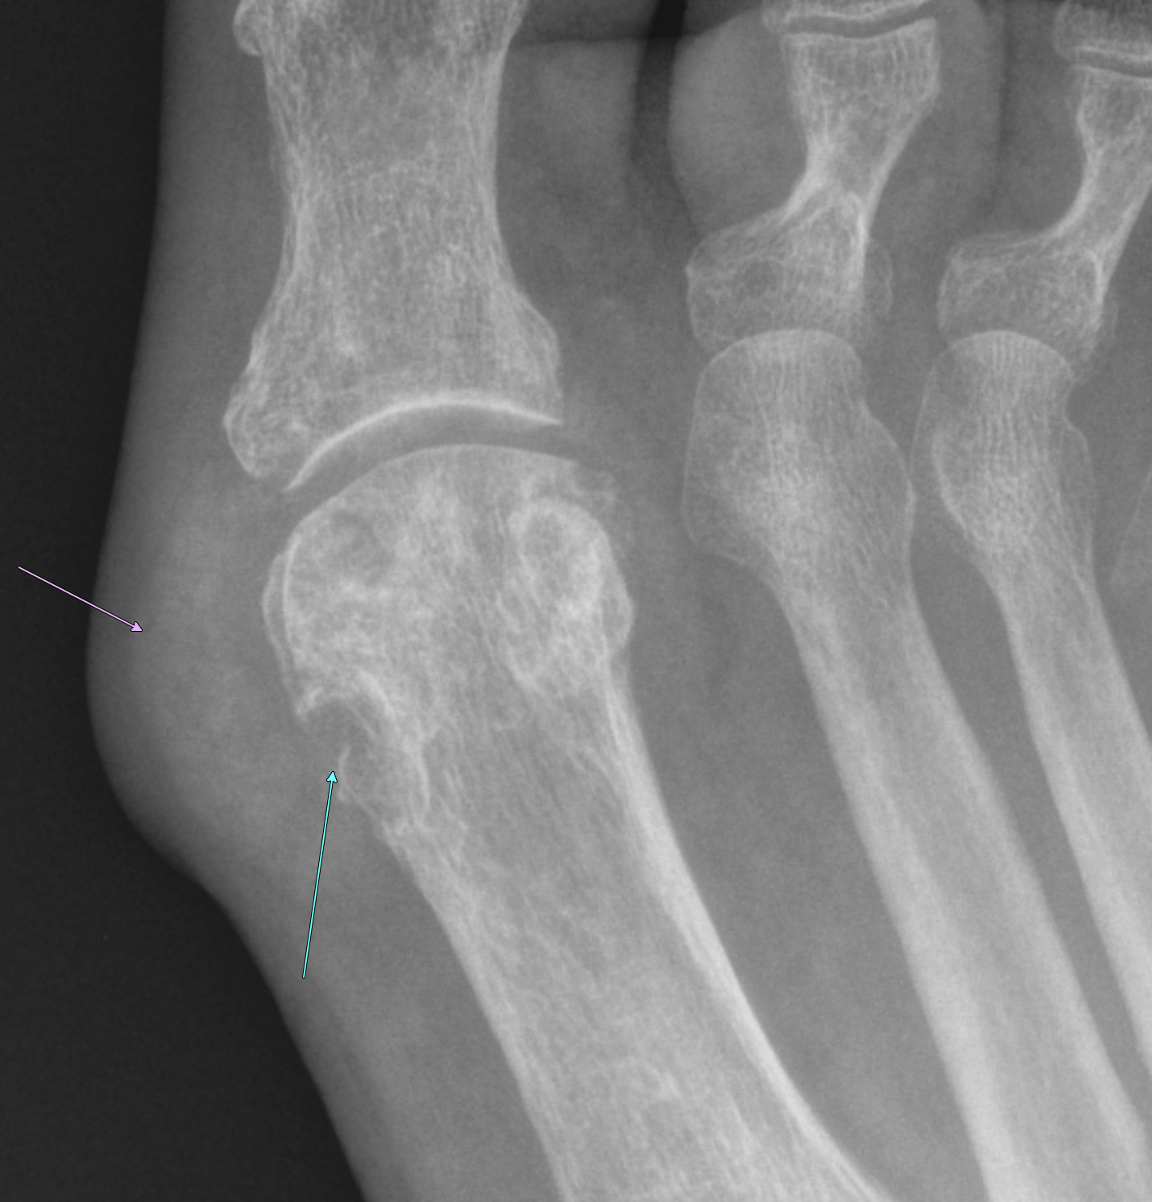
Imaging Findings: Coned down AP projection centered on the first metatarsal head reveals an osseous erosion with overhanging edge (blue arrow) and adjacent soft tissue mineralization compatible with tophus (pink arrow). There is no joint space narrowing, peri-articular osteopenia, or osteophyte formation.
Diagnosis: Gout
Course: The patient was prescribed colchicine with rapid resolution of symptoms. Allopurinol was prescribed for prevention of future gout flares. The patient was counseled to achieve a normal body mass index and reduce consumption of alcohol and meats high in purine content such as beef, liver, and shellfish. Several months after this presentation, the patient was doing well without subsequent gout flares.
Discussion: Gout is an inflammatory crystalline arthropathy resulting from articular and peri-articular deposition of monosodium urate crystals. Radiography can demonstrate bone erosions with overhanging edges and soft tissue tophus formation, as seen in this case. Dual energy CT can also assess for presence of uric acid deposition. The most common sites of involvement are the metatarsophalangeal joints, knee, ankle, and wrist. Risk factors include male gender, obesity, excessive alcohol, soda, and/or meat consumption, and certain medications such as diuretics. Treatment is a combination of lifestyle modification and pharmacologic agents.
July 2024: Biceps Tendon Rupture
History: A young male presented with acute arm pain and swelling after catching a heavy box while helping his friend move. Clinically there was concern for biceps tendon rupture. Imaging of the arm was performed.
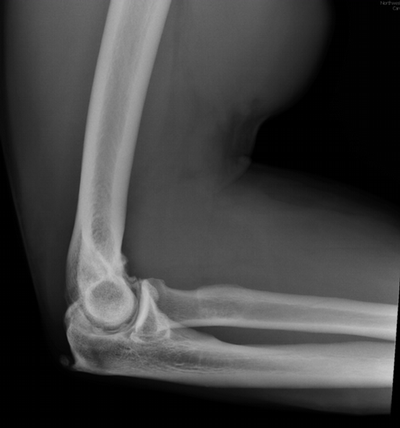
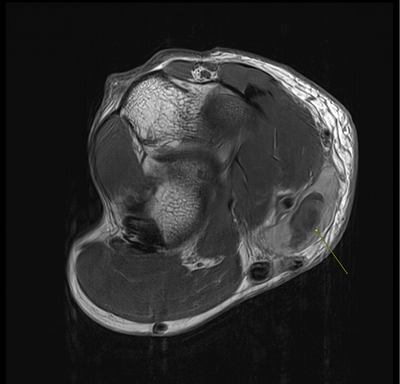
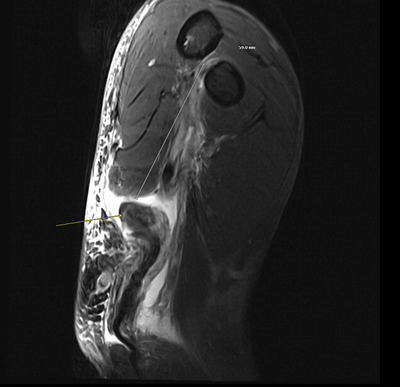
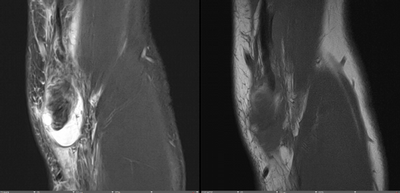
Imaging Findings: The elbow radiograph lateral projection is notable for a popeye sign, with bulging soft tissue in the region of the distal biceps, highly concerning for biceps tendon rupture. The follow up elbow MRI reveals complete rupture of the distal biceps tendon. The tendon stump is thickened and edematous with surrounding fluid. The tendon stump is retracted approximately 5.9 cm proximal to its insertion on the radial tuberosity.
Diagnosis: Distal biceps tendon rupture.
Hospital Course: The patient underwent biceps tendon repair the next day with orthopedic surgery. The tendon was anchored to the radial tuberosity with suture. The patient was discharged and did well with outpatient physical therapy. He reported no residual deficit in supination or elbow flexion six months after the surgery.
Discussion: The biceps brachii consists of two heads originating from the coracoid process (short head) and the supraglenoid tubercle of the scapula (long head). The heads fuse into one tendon which inserts onto the radial tuberosity. The biceps tendon is a strong supinator of the forearm and assists with elbow flexion. Proximal biceps tendon rupture is commonly seen in older patients and is more common than distal biceps rupture in this population. Distal tendon rupture is more common in younger patients who are athletes or weightlifters. Injury to the distal tendon usually requires surgical repair but can be treated conservatively if loss of supination and elbow flexion strength is acceptable to the patient.
June 2024: Acute Embolic Stroke
History: An elderly patient presented to the emergency department with acute onset left sided weakness and altered mental status. Physical exam was notable for left facial droop, left arm, and left leg weakness. Stroke code was activated and CT imaging of the head was performed. NIH stroke score was 23 per the stroke service.
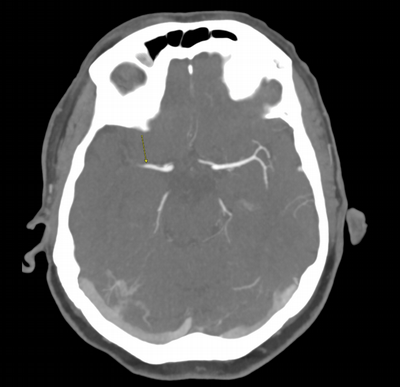
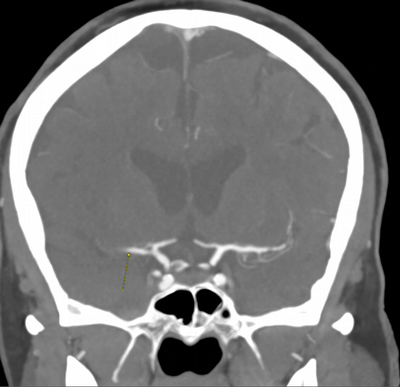
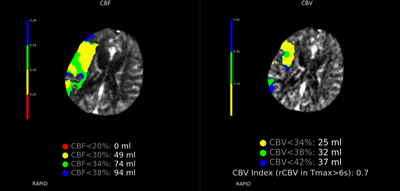
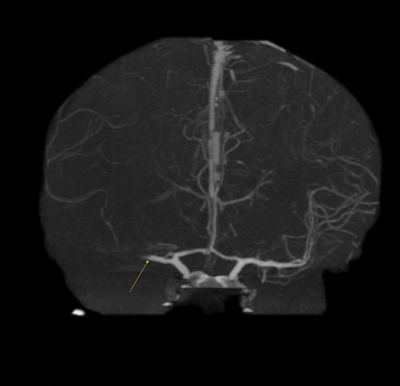
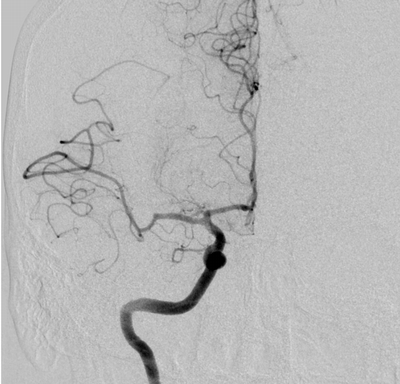
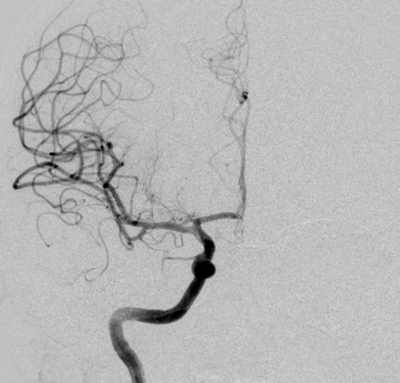
Imaging Findings: The initial non-contrast CT head (not shown) was unremarkable, without hemorrhage or territorial hypoattenuation. CT angiogram revealed abrupt cutoff of the right M1 segment and non-opacification of the M2 superior division. CT perfusion reveals an ischemic penumbra in the right MCA territory with a smaller ischemic core. Coronal digital subtraction angiography performed in the interventional neuroradiology suite confirms the large vessel occlusion in the distal right M1 segment. Post-thrombectomy coronal DSA shows restored perfusion in the MCA M1 segment and M2 superior division.
Diagnosis: Acute right MCA territory ischemic infarct secondary to occlusion of the middle cerebral artery at the origin of the M2 superior division.
Hospital Course: The initial head CT revealed no intracranial hemorrhage. The patient arrived within the window for pharmacological thrombolysis and received IV tenecteplase. Neurointerventional radiology took the patient for emergent thrombectomy which successfully restored perfusion to the right M2 superior division. Subsequently, the patient recovered some function of their left side. Workup revealed a new diagnosis of atrial fibrillation, suggesting a cardioembolic etiology of the stroke.
Discussion: Acute ischemic stroke is the onset of focal neurological deficits in a vascular territory affecting the brain or spinal cord due to reduced or absent perfusion. Stroke accounts for 1 in 6 deaths from cardiovascular disease. Annually, over 795,000 Americans suffer from a stroke annually. The financial burden of stroke in the US amounted to $56 billion in 2019. The MCA is the most common artery involved in stroke, with characteristic presentation of facial droop and upper>lower extremity weakness. Rapid diagnosis and treatment are crucial to preserve as much brain tissue as possible. Noncontrast CT brain imaging is required to rule out hemorrhage before initiating fibrinolytic agents such as alteplase and Tenecteplase. Endovascular thrombectomy is an option in select patients with large vessel occlusions, such as in this case.
May 2024: Splenic Trauma
History: A middle-aged male presented to the emergency department with left upper quadrant pain. He reported recent blunt trauma to the area. He was hemodynamically stable with left upper quadrant tenderness on physical exam. Lab work was within normal limits. A CT angiogram of the abdomen and pelvis was performed given the concern for splenic injury.
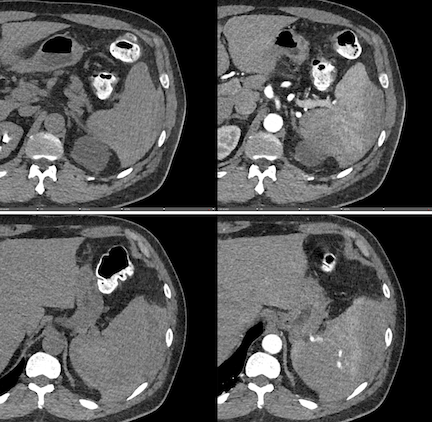
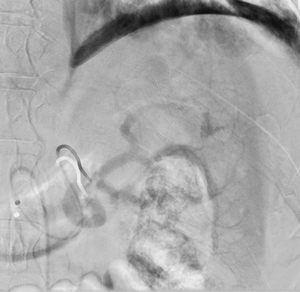
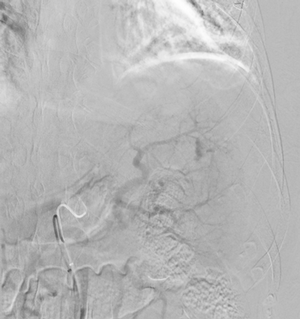
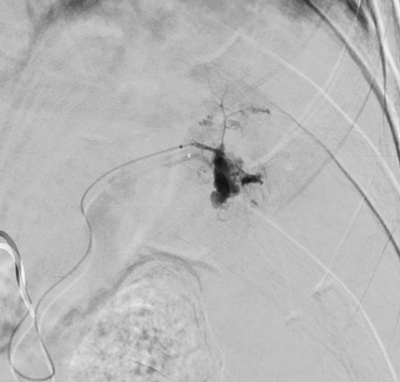
Imaging Findings: Pre-contrast images demonstrate hyperdense fluid representing hemoperitoneum surrounding the spleen. Arterial phase images demonstrate abnormal foci of enhancement within the splenic parenchyma compatible with pseudoaneurysms given the setting of trauma. Blood products are seen pooling within the spleen representing intrasplenic hematomas. Digital subtraction angiography with selective catheterization of the splenic artery reveals the splenic pseudoaneurysms in greater spatial resolution. Status post embolization with coils and gelfoam, the pseudoaneurysms no longer fill with contrast signifying successful treatment.
Diagnosis: Traumatic splenic artery pseudoaneurysms.
Hospital Course: The patient was taken urgently to the Interventional Radiology angiosuite for invasive angiography. Selective catheterization of the splenic artery revealed multiple pseudoaneurysms, concordant with the CTA findings. The pseudoaneurysm were embolized with coils and gelfoam with no residual filling. The patient did well post-operatively with stable hemoglobin levels. He was discharged home the next day.
Discussion: The spleen is a highly vascular organ and one of the most commonly injured organs in the setting of abdominal trauma. Missed or delayed diagnosis of splenic trauma can result in acute blood loss anemia, hypovolemic shock, and death. Radiologic grading of splenic trauma helps determine the treatment strategy. Treatment options range from blood transfusions, endovascular embolization, or operative splenectomy. Splenectomy is the most invasive treatment and avoided if possible as it raises risk of post-splenectomy sepsis secondary to encapsulated bacteria (Streptococcus, Neisseria meningitis, and Haemophilus influenzae type B). Interventional radiologists perform splenic artery embolization either as definitive therapy, such as in this case, or before surgery to reduce bleeding during the splenectomy.
April 2024: Emphysematous Cystitis
History: A middle-aged patient with a history of poorly controlled type 2 diabetes mellitus complicated by neurogenic bladder and recurrent urinary tract infections presented to the emergency department with dysuria, pneumaturia, and chills. Physical exam demonstrated suprapubic tenderness without costovertebral angle tenderness. Lab work was notable for leukocytosis and bacteriuria on urinalysis. A CT scan of the abdomen and pelvis was performed.
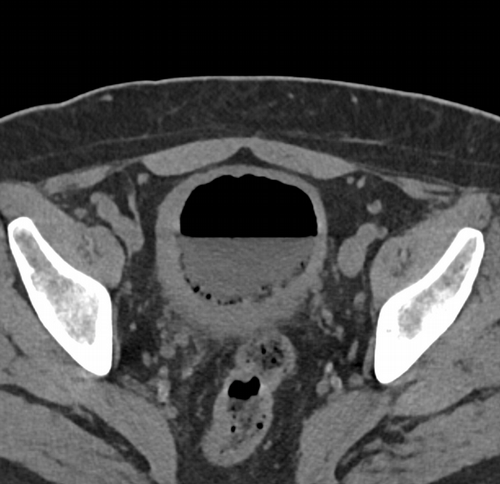
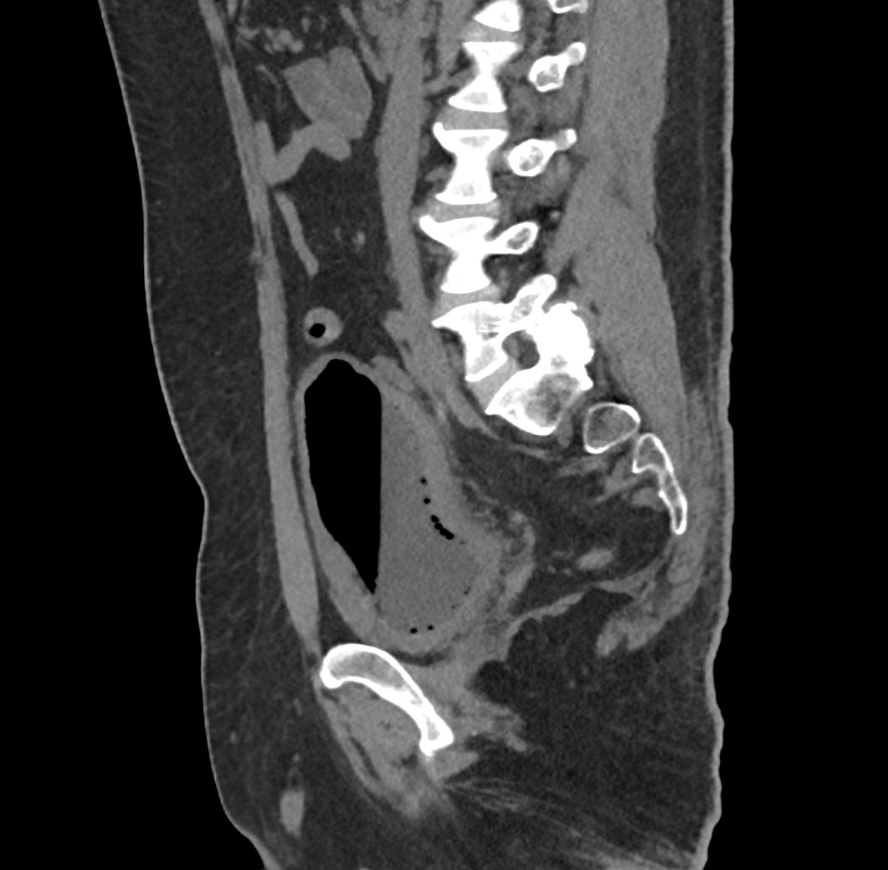
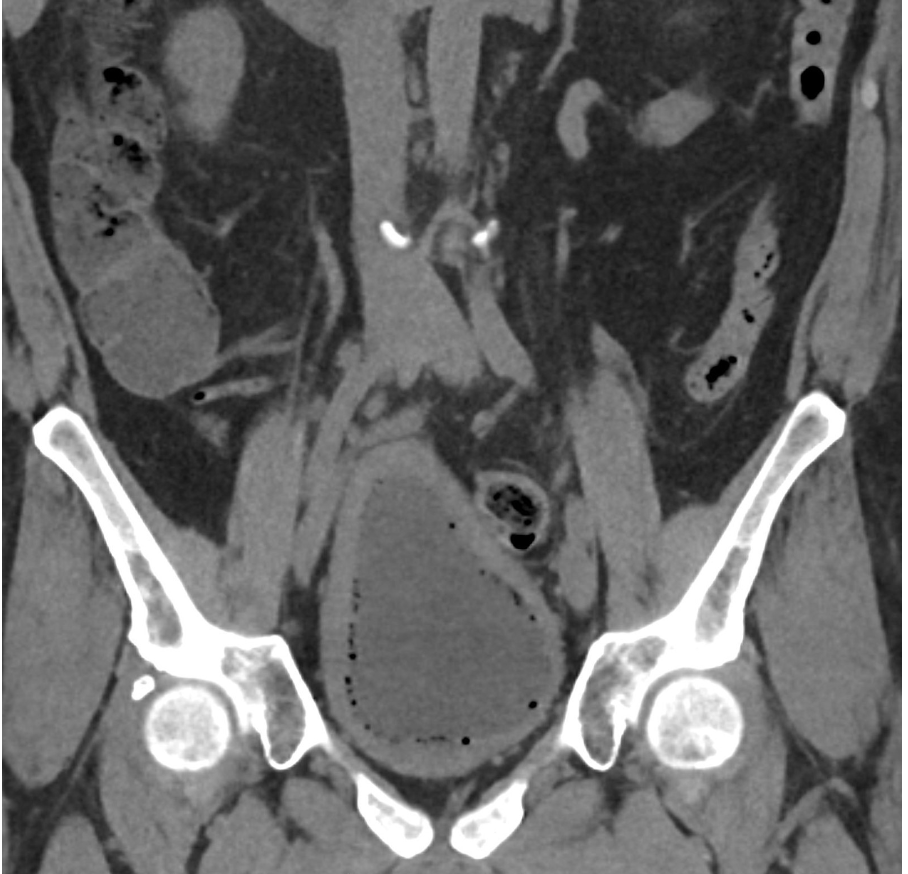
Imaging Findings: CT of the abdomen and pelvis demonstrates numerous small foci of air in the bladder adjacent to the non-dependent portion of the bladder mucosa. There is also bladder wall thickening out of proportion to the degree of underdistension. The kidneys (not pictured) demonstrated symmetric nephrograms without evidence of pyelonephritis. There were no urothelial stones.
Diagnosis: Emphysematous cystitis.
Hospital Course: A foley catheter was placed in the emergency department and IV antibiotics were initiated. Urine culture grew Klebsiella pneumoniae. The patient improved symptomatically, and his leukocytosis normalized. He was discharged home with the foley catheter and oral antibiotics with a plan for short term follow-up with the urology service. He did well with medical management and the foley catheter was removed. He was counseled on the importance of managing his diabetes.
Discussion: Emphysematous cystitis is a rare complication of cystitis. It is most commonly seen in the setting of poorly controlled diabetes, neurogenic bladder, recurrent urinary tract infections, or in patients with an immucompromised state. Symptoms may include pneumaturia or dysuria although some patients are asymptomatic. Delay in diagnosis or treatment can result in the feared complication of emphysematous pyelonephritis which has high mortality and is managed with urgent nephrectomy. Imaging is the gold standard for diagnosis and used to evaluate for complications such as abscess, infected urothelial stones, or pyelonephritis.
March 2024: Tension Pneumothorax
History: A young male with no past medical history presented to the emergency department with acute onset chest pain and shortness of breath which woke the patient from sleep. Physical exam revealed decreased breath sounds on the right. A stat chest radiograph was ordered.
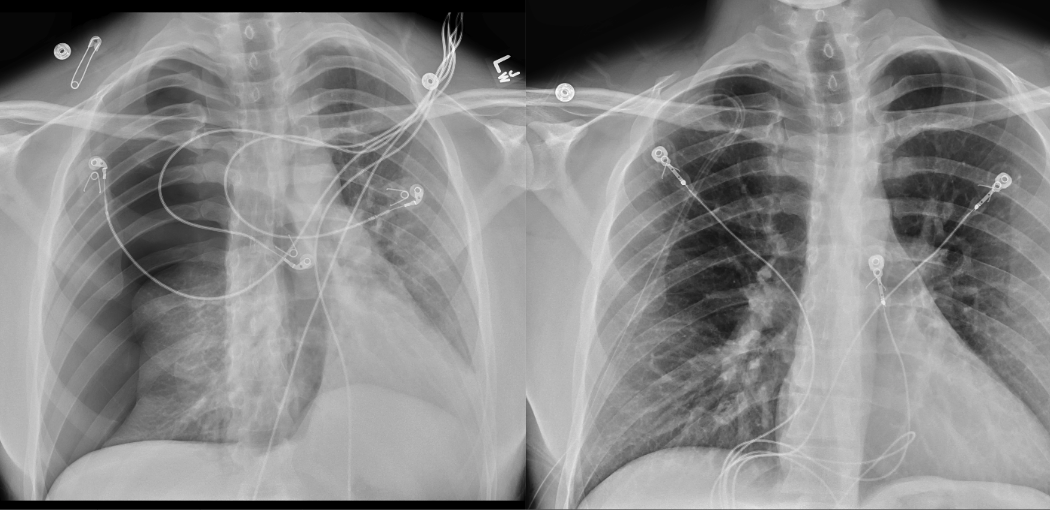
Imaging Findings: The initial chest radiograph (screen left) reveals a large right pneumothorax with leftward mediastinal shift, diaphragmatic flattening, and mass effect on the right side of the heart indicating tension physiology. The post chest tube placement radiograph (right) demonstrates re-expansion of the right lung. The mediastinal shift, diaphragmatic depression, and mass effect on the heart has resolved.
Diagnosis: Right tension pneumothorax.
Hospital Course: A chest tube was emergently placed by interventional radiology under fluoroscopic guidance with immediate resolution of the patient’s symptoms. While hospitalized, the patient underwent workup for underlying pulmonary disease or connective tissue abnormality which can predispose to pneumothorax. No underlying abnormality was discovered, and a diagnosis of primary spontaneous pneumothorax was given. The chest tube was clamped and removed without pneumothorax recurrence. The patient was discharged with precautions to avoid Valsalva maneuver and scuba diving. If pneumothorax ever recurs, he will be referred to thoracic surgery for definitive management.
Discussion: Pneumothorax is the accumulation of air in the pleural space. Tension physiology indicates progressive accumulation of pressure, which can cause compression of the airway, great vessels, and heart leading to cardiac arrest and death. Disruption of the pleura from trauma or underlying lung disease are the most common etiologies. Tension pneumothorax must be treated with prompt needle decompression or chest tube placement to allow the air trapped in the pleural space to escape. If the pneumothorax does not resolve with these measures, thoracotomy or video-assisted thorascopic surgery is performed and the pleural space is obliterated.
February 2024: Intracranial Abscesses
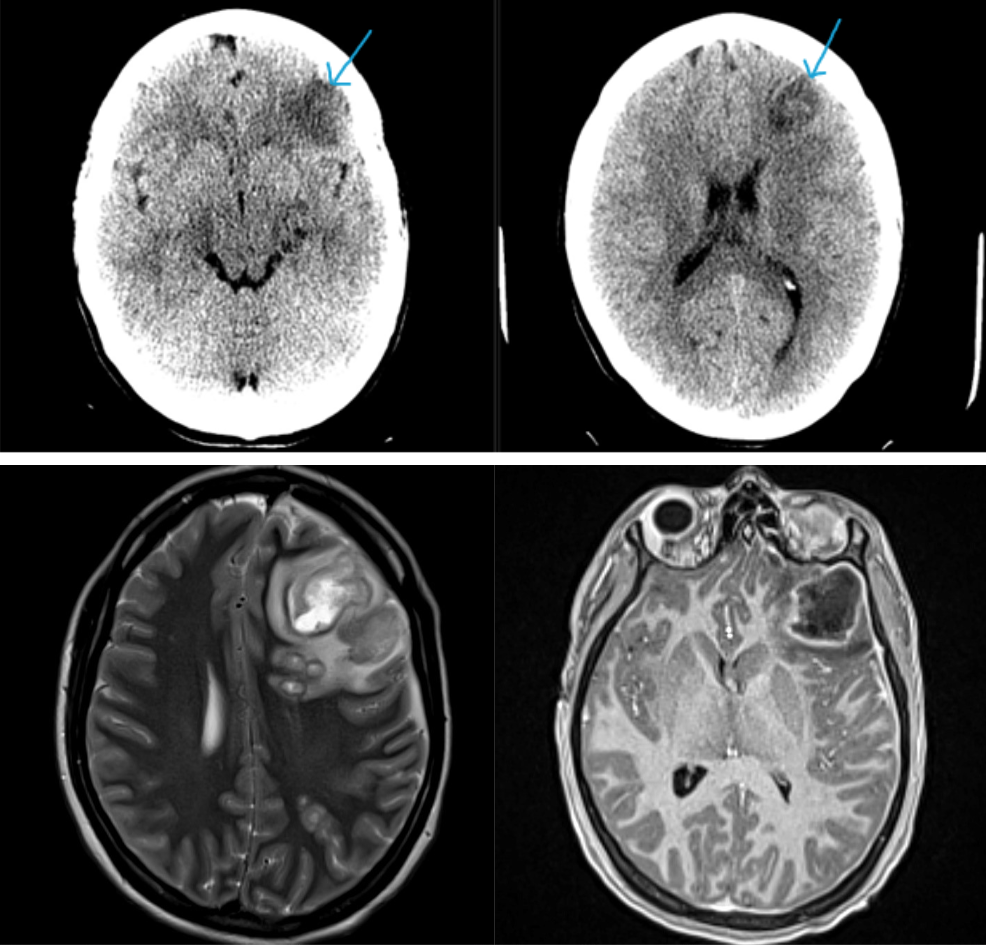
History: A previously healthy young adult presented to the emergency department with fever and altered mentation. Physical exam revealed receptive aphasia, extremity weakness, and right facial droop. Lab work was unremarkable. Cross-sectional imaging of the brain was ordered.
Findings:
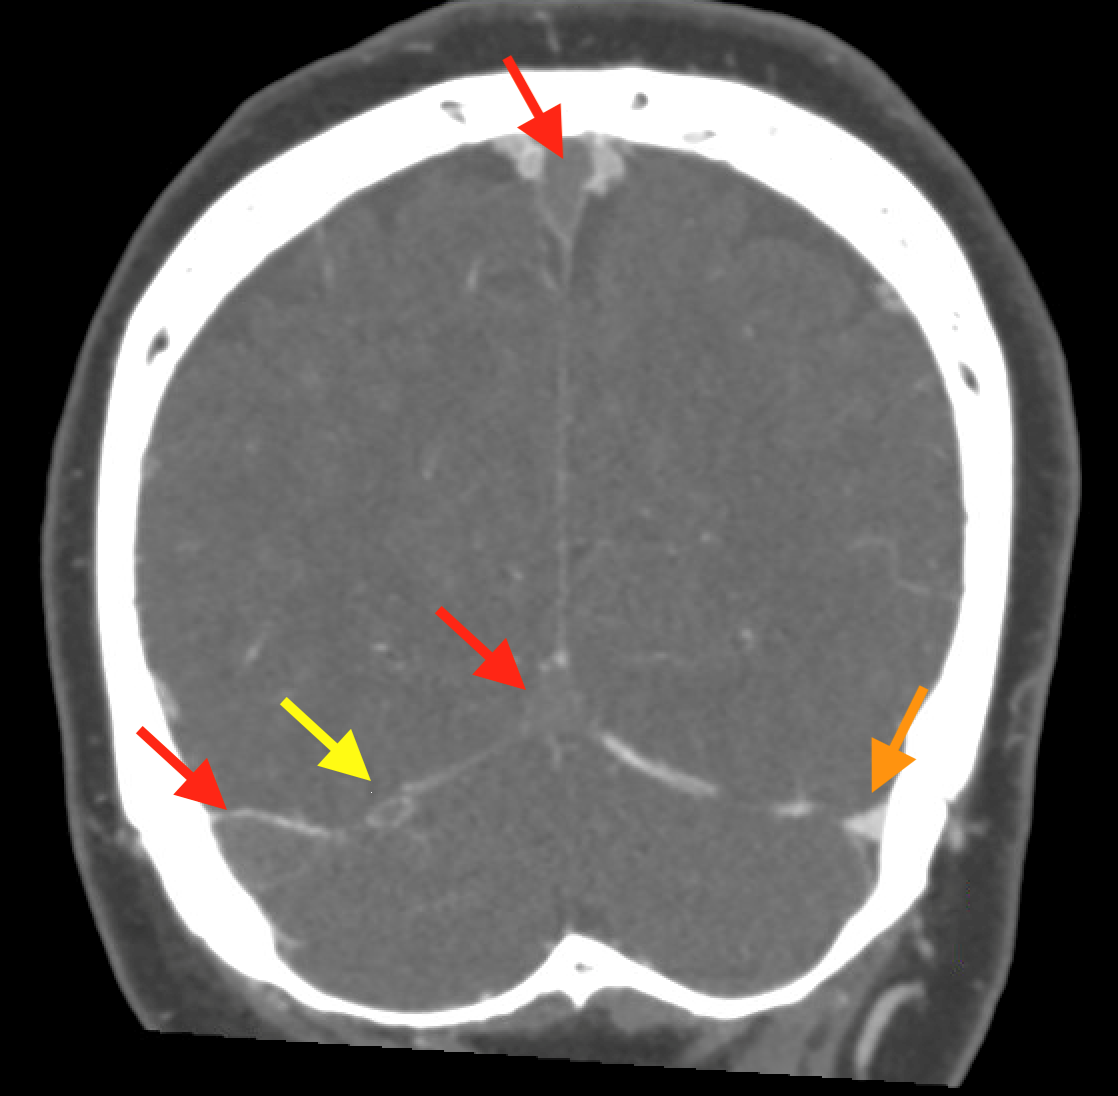
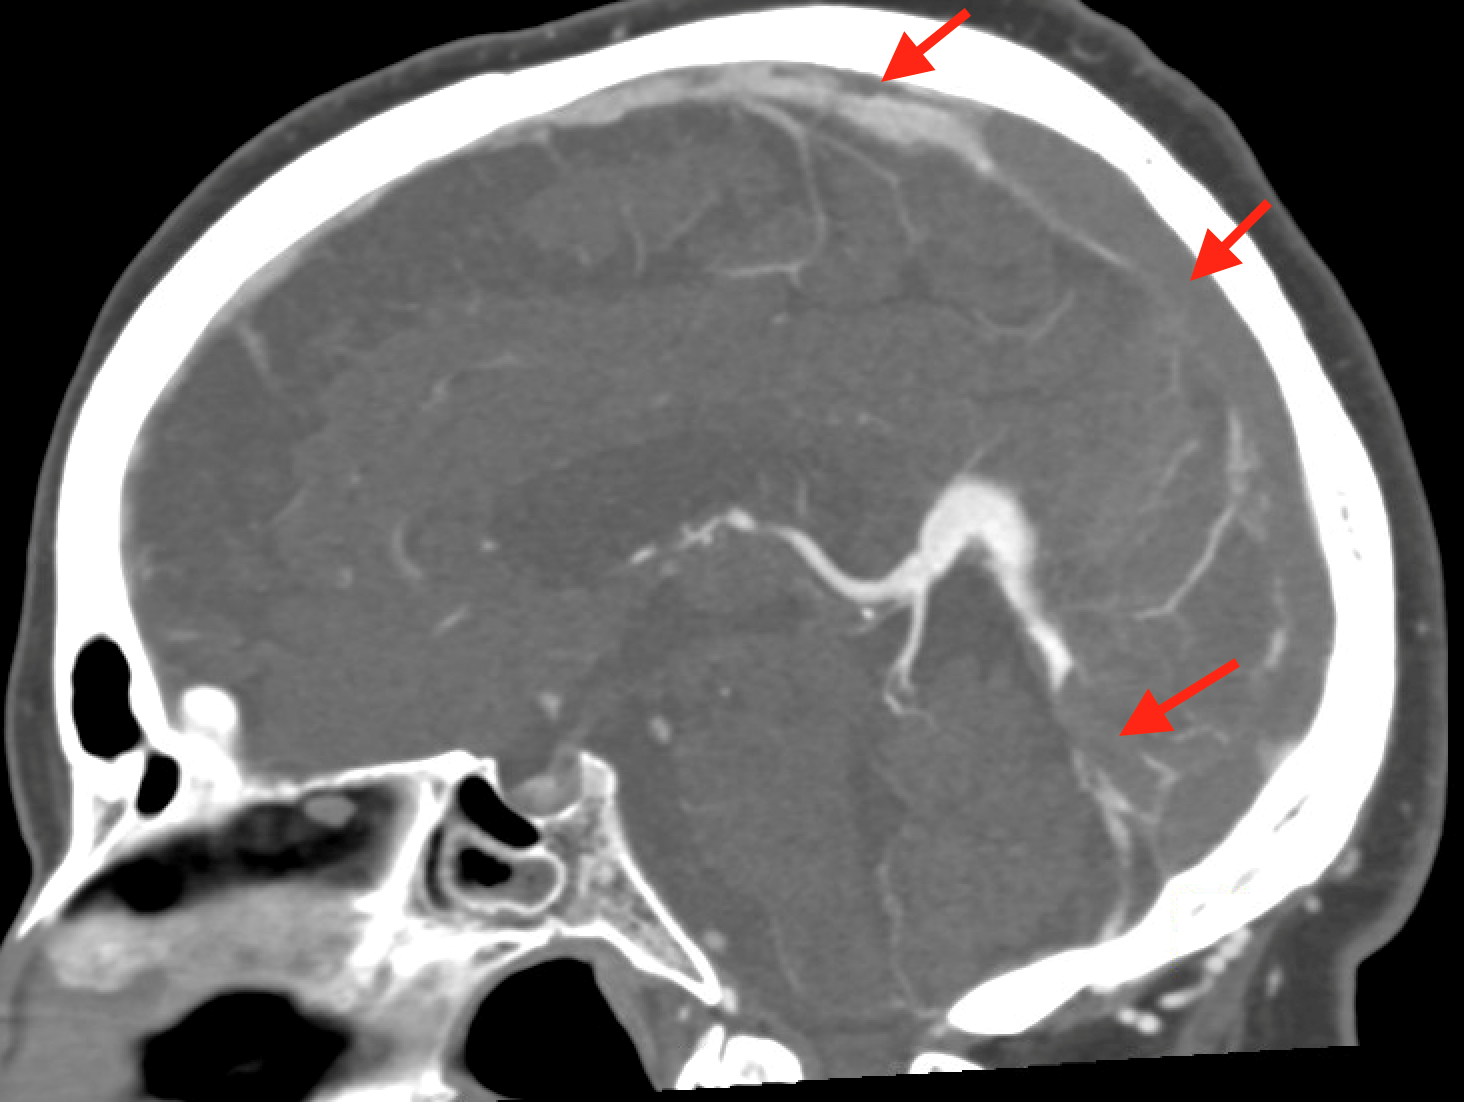
Non-contrast brain CT revealed rounded areas of hypoattenuation in the left frontal lobe (blue arrows). Follow-up brain MRI with contrast revealed rim enhancing lesions of varying sizes in the right frontal and parietal lobes with associated diffusion restriction. There is a peripherally enhancing subdural fluid collection overlying the right frontal convexity (red arrows). Confluent T2 and FLAIR hyperintense signal surrounds the enhancing lesions. Mass effect results in rightward midline shift.
Diagnosis: Intracranial abscesses with subdural empyema.
Hospital Course: The patient underwent left frontoparietal craniectomy and washout with neurosurgery. The subdural empyema was evacuated and the larger abscesses located peripherally in the brain were drained. The smaller abscesses deeper in the brain were not suitable for operative intervention given their sensitive location. Post-operatively the patient’s aphasia and extremity weakness improved. Surgical cultures grew Fusobacterium necrophorum, an anaerobic gram-negative rod. Infectious disease recommended treatment with IV penicillin and oral metronidazole until there was clinical and imaging evidence of resolution. Follow up imaging three months later revealed resolution of the abscesses with no evidence of recurrent infection and the antibiotics were discontinued. The patient subsequently underwent cranioplasty with plastic surgery to restore the left craniectomy defect.
Discussion: Intracranial infection can result from bacteria, viruses, fungi, parasites, and rarely prions. Transmission can occur via direct local spread from head trauma, paranasal sinusitis, or hematogenous spread in the setting of septicemia. Presenting symptoms include headache, mental status change, fever, and seizures. White blood cell count can be normal, as it was is in this case. MRI with contrast is the gold standard to diagnose complications of intracranial infection such as intracranial abscesses, empyema, ventriculitis, and sinus venous thrombosis. Treatment typically involves antibiotic administration with the need for surgical intervention determined by the presence of the complications described above.
January 2024: Perforated Acute Appendicitis
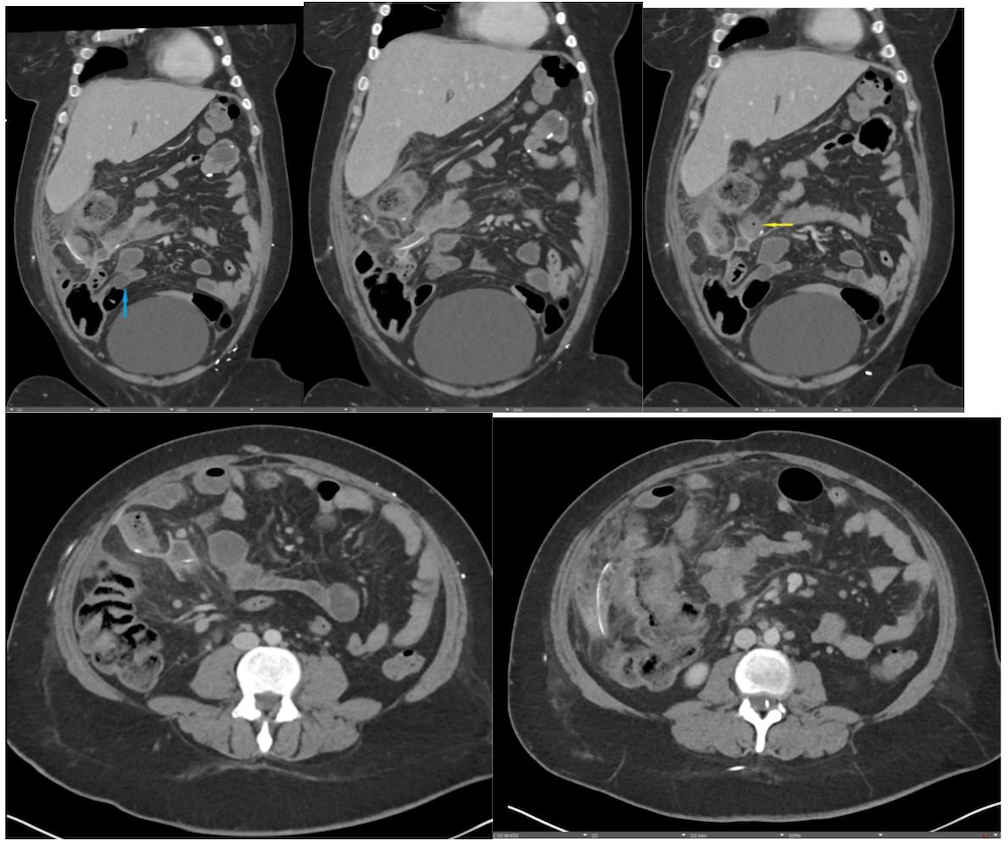
History: A young adult presented to the emergency department with several days of abdominal pain. History was notable for a congenital intracranial malformation treated with a lumboperitoneal shunt. Physical exam revealed right abdominal tenderness to palpation. Lab work was notable for leukocytosis of 22,000.
Findings:
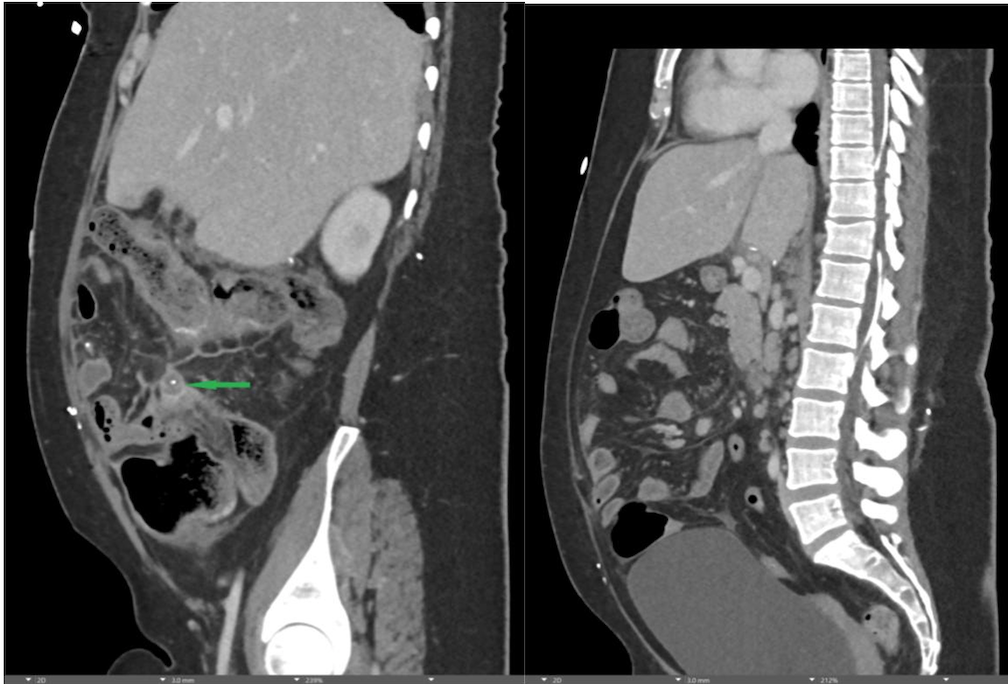
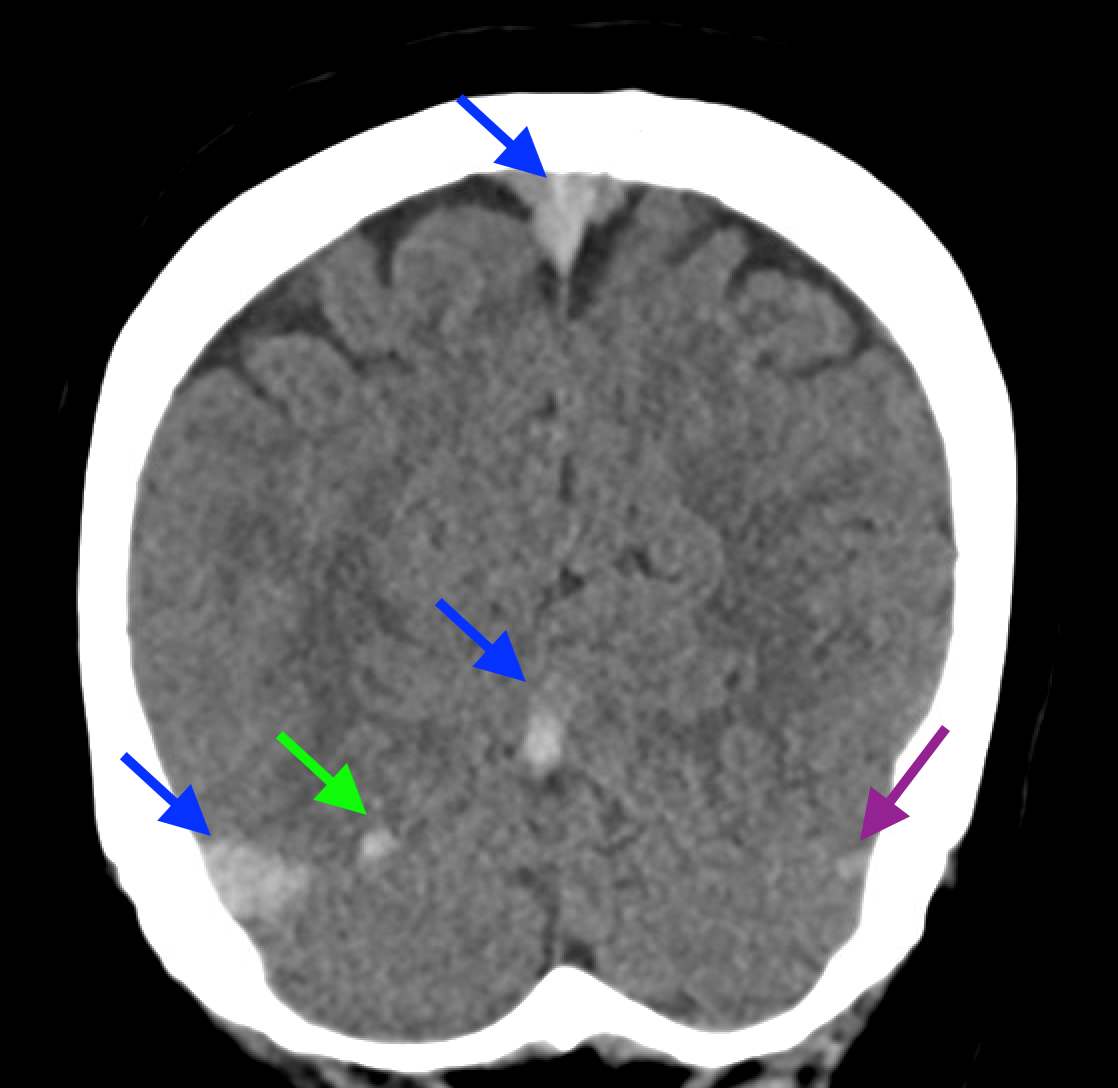
A CT of the abdomen and pelvis with IV contrast was obtained, demonstrating dilatation of the distal appendix to 15 mm (blue arrow) with extensive fat stranding in the right hemiabdomen. The intraperitoneal component of the lumboperitoneal shunt is seen traversing through the inflamed abdomen with a peripherally enhancing fluid collection encasing a portion of the catheter (green arrow). No obvious abnormality is seen regarding the intraspinal portion of the catheter. Small bowel loops in the right hemiabdomen demonstrate reactive wall thickening (yellow arrow), and several prominent reactive mesenteric lymph nodes are also seen.
Diagnosis: Perforated acute appendicitis complicated by an abscess encasing the peritoneal catheter.
Hospital Course: The patient was taken urgently to the operative room for combined surgery with neurosurgery and general surgery. Purulence was noted within the abdomen during laparoscopy and the intraperitoneal portion of the lumboperitoneal shunt was explanted. The appendix appeared inflamed and thus laparoscopic appendectomy was performed. The appendix was sent for surgical pathology, which confirmed the diagnosis of perforated appendicitis. The patient had an unremarkable post-operative course and was discharged home with a short course of oral antibiotics. The lumboperitoneal shunt catheter had been turned off for several years prior to presentation and no revision or replacement was needed per the evaluation of neurosurgery.
Discussion: Acute appendicitis is inflammation of the appendix secondary to obstruction of its lumen resulting in bacterial proliferation. It most commonly occurs between the ages of 10 and 40. Perforation is a feared complication of appendicitis as it can result in abscess formation and peritonitis. Appendectomy is the gold standard for treatment in the United States. Severe cases of appendicitis may necessitate conversion to ileocecectomy or right hemicolectomy based on the intra-operative findings. Appendiceal malignancy can mimic the imaging and intra-operative appearance of acute appendicitis, requiring pathologic confirmation of the diagnosis after appendectomy.
June 2023: Discitis-Osteomyelitis
History: A 50-year-old female presented to the Emergency Department with right lower quadrant pain. A contrast-enhanced CT of the abdomen and pelvis was performed, revealing suspicious findings in the lumbar spine, which prompted further evaluation with contrast-enhanced MRI of the lumbar spine.
Findings:
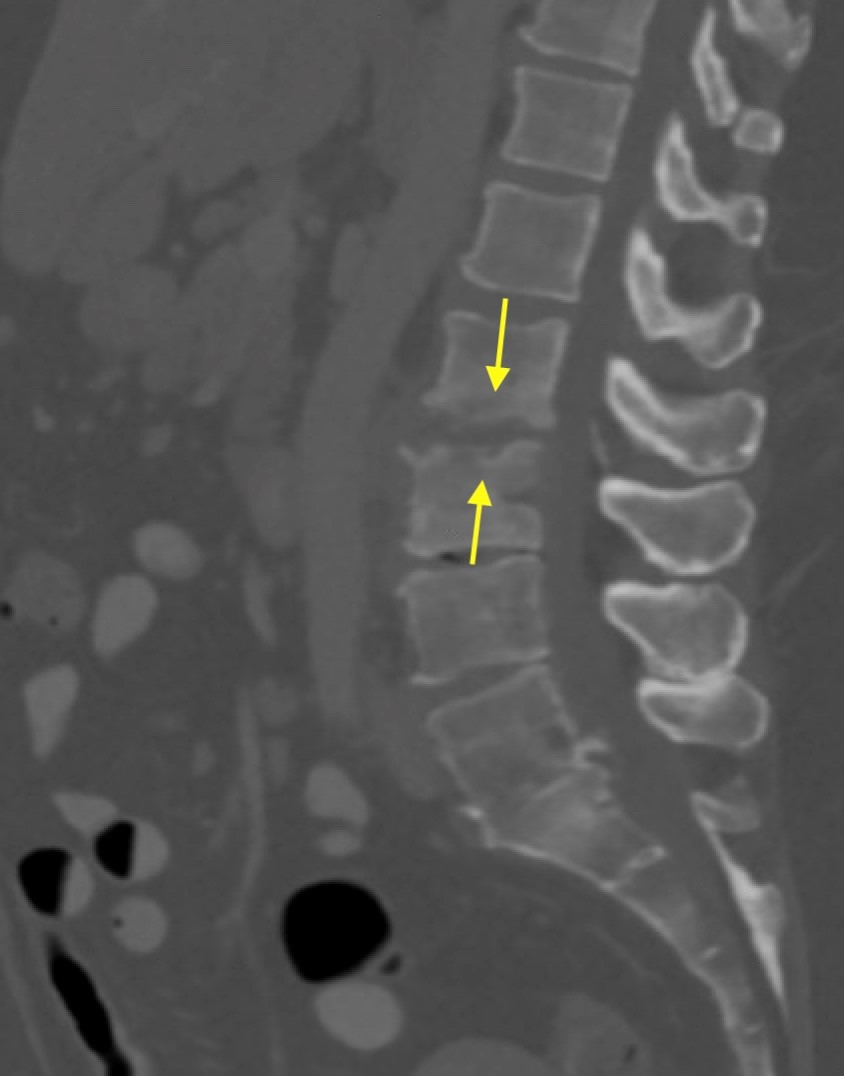
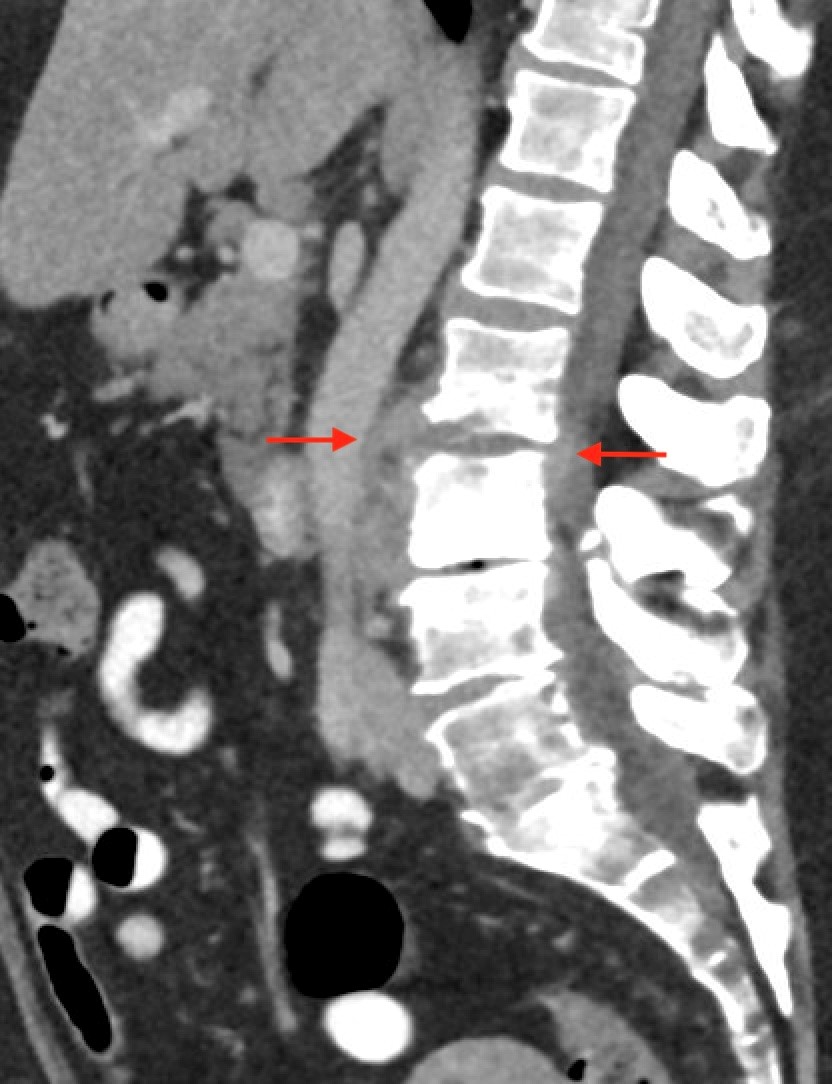
Shown above, sagittal post-contrast CT of the abdomen and pelvis in bone window demonstrates cortical erosions of the inferior endplate of the L2 vertebral body and the superior endplate of the L3 vertebral body (yellow arrows). Soft tissue window on the same study highlights associated prevertebral heterogeneous soft tissue at this level; soft tissue also extends into the ventral epidural space at the L2-3 level (red arrows).
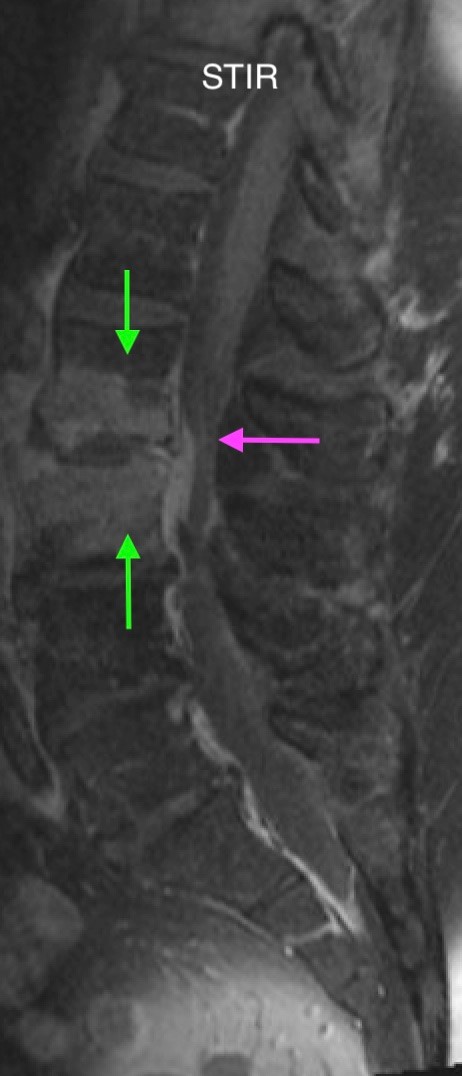
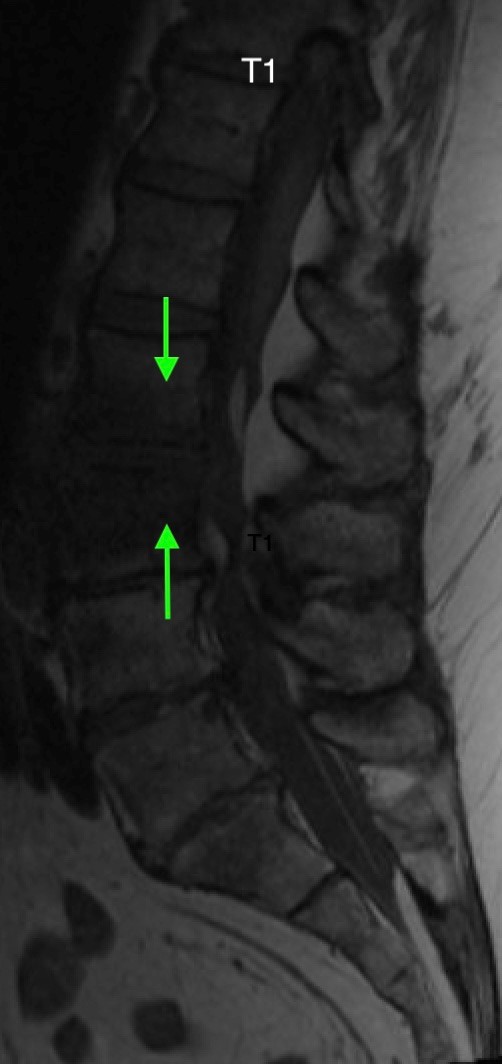
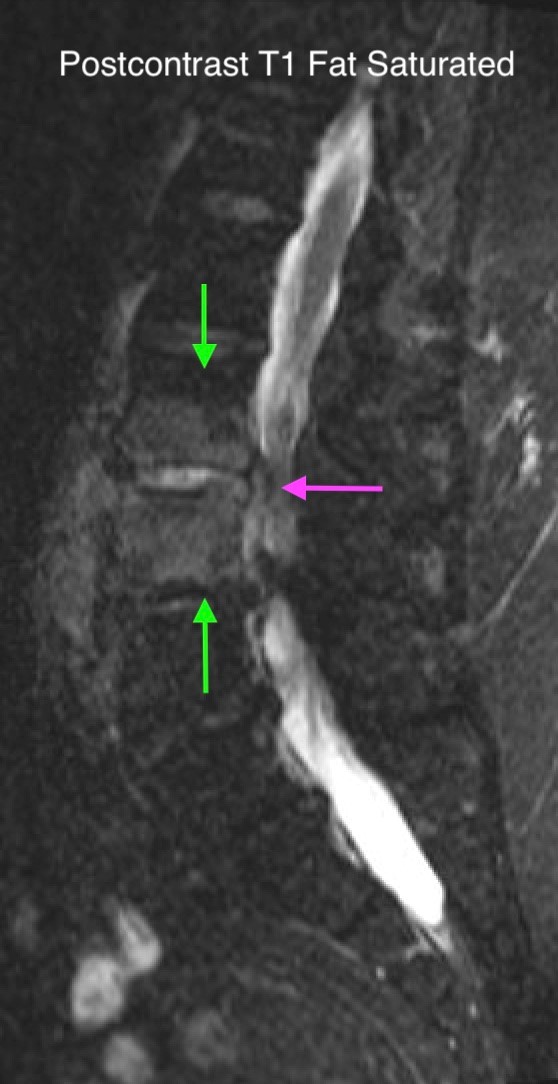
Heterogeneous STIR hyperintense signal is present in the L2-3 disc space and extends to the inferior endplate of the L2 vertebral body and the superior endplate of the L3 vertebral body (green arrows). Comparison between T1 and T1 postcontrast fat saturated images demonstrates associated heterogeneous enhancement in these regions (green arrows). STIR hyperintensity and enhancement extends along the ventral epidural space at the L2-3 level consistent with an epidural phlegmon (purple arrows).
No abnormal cord signal is identified in the distal cord or conus. The above findings are superimposed upon multilevel degenerative changes which altogether result in up to severe spinal canal stenosis at the L2-3 level.
Diagnosis: Discitis-Osteomyelitis
Teaching Points:
Discitis-osteomyelitis is the infection of vertebrae and associated intervertebral discs. Risk factors include immunocompromised state, IV drug use, and diabetes. In adults, it often occurs through hematogenous bacterial seeding of vertebral bodies, which are particularly susceptible due to their slow arterial inflow. Infection then readily spreads to adjacent avascular discs. Patients present with back or neck pain as well as fevers, although inconsistently.
Changes from discitis-osteomyelitis are often not apparent on plain radiographs up until six weeks. Contrast-enhanced MRI is the modality of choice in diagnosis, in part because it delineates extent of spinal canal involvement. T1-weighted images demonstrate low signal intensity involving the affected vertebral endplates and bodies, while T2-weighted images demonstrate corresponding high signal intensity. Fluid signal is identified in the intervertebral disc. Post-contrast imaging demonstrates homogeneous, patchy, or peripheral enhancement in the affected disc and diffuse enhancement in the affected bone marrow. Associated paravertebral and epidural phlegmon or abscess are characterized by heterogenous signal intensity on T1 and T2-weighted sequences, typically hypointense signal on T1-weighted images and hyperintense signal on T2-weighted images. Post-contrast imaging demonstrates diffuse/rim-like enhancement in the paravertebral and epidural soft tissues.
The utility of CT in the diagnosis of discitis-osteomyelitis is limited. CT may not reveal early destructive vertebral endplate changes and cannot reliably demonstrate extent of spinal canal involvement. However, it may help demonstrate associated adjacent soft tissue masses and abscesses, as in the above case.
Important differential considerations include degenerative endplate disease and neuropathic joint changes. Unlike discitis-osteomyelitis, degenerative changes do not show high signal intensity of the disc on T2-weighted images; there is also no soft tissue involvement. There may be associated vacuum phenomenon. Neuropathic joint changes may include joint debris, spondylolisthesis, lower signal intensity of disc/marrow on T2-weighted images, paraspinal masses related to inadequately healed fractures, and vacuum phenomenon.
Most patients with discitis-osteomyelitis are treated with six weeks of systemic antimicrobials, while others require surgery due to factors such as cord compression or inadequate response to antibiotics. Follow-up MRI is generally not indicated, as imaging findings can lag behind clinical improvement by 4-6 weeks.
References:
An HS, Seldomridge JA. Spinal Infections. Clinical Orthopaedics & Related Research. 2006;444:27-33. doi:https://doi.org/10.1097/01.blo.0000203452.36522.97
Babic M, Simpfendorfer CS. Infections of the Spine. Infectious Disease Clinics of North America. 2017;31(2):279-297. doi:https://doi.org/10.1016/j.idc.2017.01.003
Hong SH, Choi JY, Lee JW, Kim NR, Choi JA, Kang HS. MR Imaging Assessment of the Spine: Infection or an Imitation? RadioGraphics. 2009;29(2):599-612. doi:https://doi.org/10.1148/rg.292085137
May 2023: Acute Necrotizing Pancreatitis with Venous Thrombosis
History: A 30-year-old male presented to the Emergency Department with one week of left-sided abdominal pain radiating to the back and epigastrium. A CT of the abdomen and pelvis with intravenous contrast was obtained for further evaluation.
Findings:
Contrast-enhanced axial and coronal images of the abdomen at the level of the pancreas demonstrate loculated fluid with associated peripancreatic stranding near the pancreatic tail (yellow arrow) and focal hypoenhancement in the uncinate process (green arrow). The splenic vein is thrombosed along its entire course, and focal hypoattenuation in the anterior main portal vein represents a small nonocclusive thrombus (red arrows).


Diagnosis: Acute Necrotizing Pancreatitis with Venous Thrombosis
Teaching Points:
The two subtypes of acute pancreatitis are interstitial edematous pancreatitis and necrotizing pancreatitis. Necrotizing pancreatitis comprises a smaller proportion of cases, but is characterized by worse severity of disease. There is significant mortality associated with acute necrotizing pancreatitis, ranging from 2-39%. Pancreatitis can be diagnosed when there are at least two of three of the following manifestations: characteristic abdominal pain, a three-fold increase in serum lipase or amylase, and characteristic radiological findings.
CT is considered the most useful imaging modality in the diagnosis of acute pancreatitis. Typical features include pancreatic parenchymal enlargement, peripancreatic fat stranding, and associated fluid collections.
According to the 2012 revised Atlanta classification system, there are three subtypes of necrotizing pancreatitis depending on the location of the necrosis: parenchymal, peripancreatic, and combined. Normal pancreatic parenchyma maximally enhances approximately 40 seconds after intravenous contrast injection. Parenchymal necrosis is suggested by focal pancreatic attenuation less than 30 Hounsfield Units. The severity of inflammation depends on the extent of parenchymal involvement. Although often difficult to diagnose on CT, peripancreatic necrosis may be characterized by linear peripancreatic stranding. Initially, this can resemble acute interstitial edematous pancreatitis, but increasing heterogeneity makes the diagnosis more definitive after 1 week.
Important complications of necrotizing pancreatitis include infection, mass effect, biliary obstruction, pancreatic duct strictures and disconnection, arterial pseudoaneurysms, hemorrhage, fluid collections (acute necrotic collections and walled-off necrosis, which are beyond the limits of this discussion), and venous thrombosis. As demonstrated in the case above, venous thrombosis is characterized by nonenhancement within a venous structure. The splenic vein is most commonly affected, although the superior mesenteric vein and portal veins may also be involved.
Treatment of acute necrotizing pancreatitis is largely comprised of fluids and nutritional support. Some patients require admission to the intensive care unit. Surgical necrosectomy is sometimes performed, although there are several minimally invasive techniques that are also used today, including imaging-guided percutaneous techniques and endoscopic methods.
References:
Shyu JY, Sainani NI, Sahni VA, et al. Necrotizing Pancreatitis: Diagnosis, Imaging, and Intervention. RadioGraphics. 2014;34(5):1218-1239. doi:https://doi.org/10.1148/rg.345130012
April 2023: Parathyroid Adenoma
History: A 65-year-old female presented to her primary care office with hypercalcemia and elevated parathyroid hormone. A nuclear medicine parathyroid scan was ordered for further evaluation.
Findings:
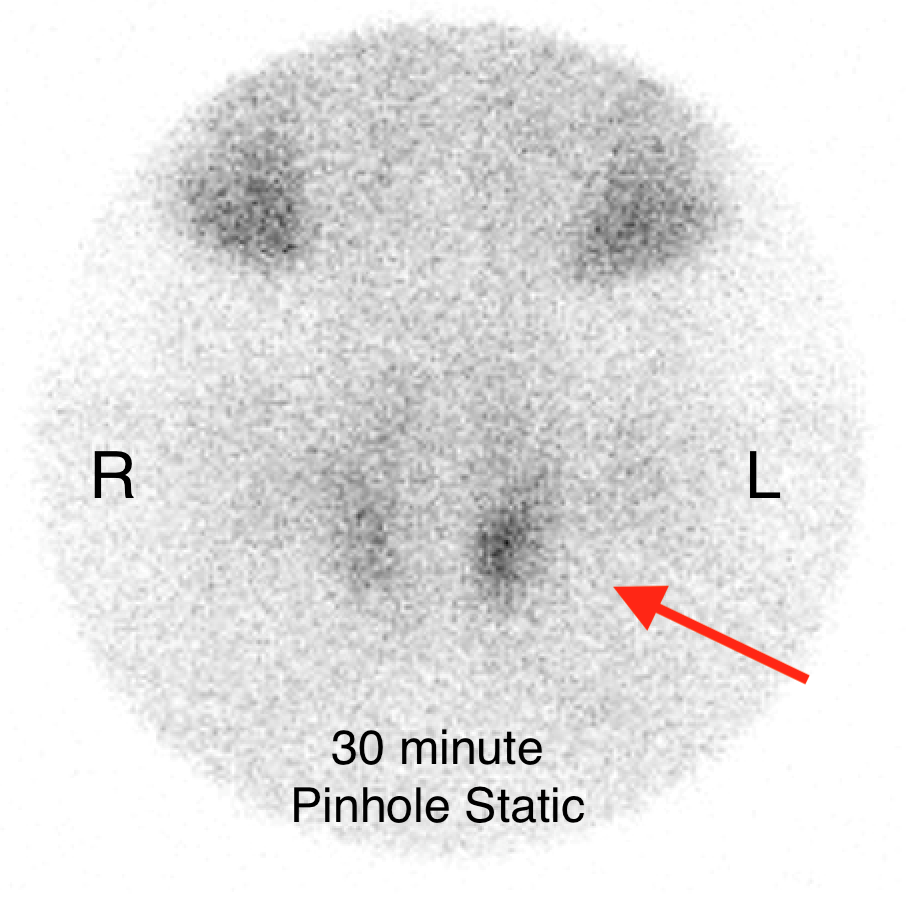
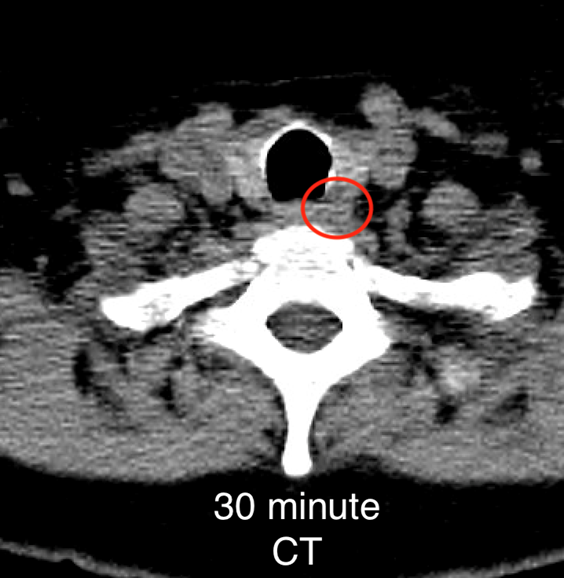
The institutional protocol for nuclear medicine parathyroid scan was followed. As seen below on the pinhole images acquired at 30 minutes, there is physiologic uptake of the radiopharmaceutical in the thyroid gland with a focal area of marked uptake in the inferior left neck (red arrow).
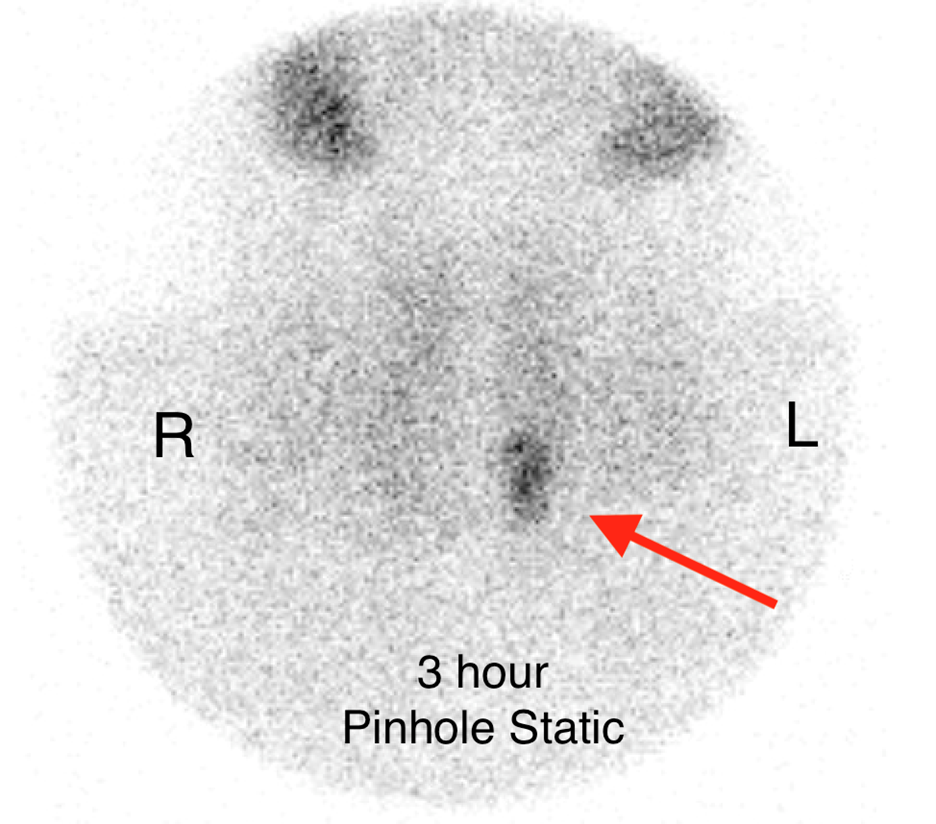
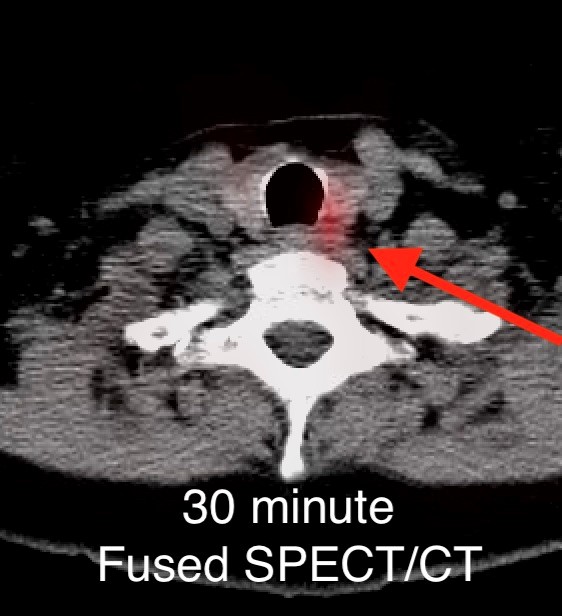
On the 3 hour delayed images, there is washout of the radiotracer from the thyroid gland with a persistent focal area of marked radiotracer uptake in the inferior left neck (red arrow). This corresponds to a nodule posterior to the inferior left thyroid lobe on the fused axial SPECT/CT (red arrow) and CT images (red circle) acquired at 30 minutes.
Diagnosis: Parathyroid Adenoma
Teaching Points:
Most cases of primary hyperparathyroidism are due to parathyroid adenomas, or tumors of the parathyroid gland. The initial diagnosis of primary hyperparathyroidism is made upon laboratory evaluation. However, imaging is crucial in determining surgical management.
A commonly used technique for diagnosing parathyroid adenomas is Tc-99m sestamibi parathyroid scintigraphy. For this exam, the patient is injected with Tc-99m-labeled sestamibi radiotracer. Planar images of the neck/mediastinum are acquired 10-30 minutes after injection followed by another set of planar images 90-180 minutes after injection. Radiotracer is initially taken up by both the thyroid gland and parathyroid glands. However, it washes out of most parathyroid adenomas slower than normal thyroid/parathyroid tissue. As in the case above, 10-30 minute images demonstrate a focus of discrete uptake. This focuso of uptake progressively increases on 90-180 minute images. Some institutional protocols also include SPECT or SPECT/CT imaging to help localize lesions.
Another nuclear medicine technique utilizes both Tc-99m sestamibi and an additional radiotracer that accumulates only in the thyroid gland, such as iodine-123 (I-123) or Tc-99m pertechnetate. I-123/Tc-99m pertechnetate images define the thyroid gland, which can then be subtracted from the Tc-99m sestamibi images to determine areas of abnormal parathyroid activity.
Other important techniques that are used to diagnose parathyroid adenomas include ultrasound and 4D-CT, beyond the scope of this discussion.
Nuclear medicine scans prove particularly useful in identifying ectopically located parathyroid adenomas in the neck/mediastinum. They are also generally operator independent. Without concomitant CT, however, these exams are quite limited in providing anatomic data. An important consideration in interpretation is that some adenomas do not follow the typical washout characteristics described above. Furthermore, various other pathologies can result in false positives, including thyroid nodules/carcinomas, other cancers, and Graves’ disease.
Imaging helps identify the presence/absence of parathyroid adenomas. Generally, parathyroid adenomas are amenable to minimally invasive thyroidectomy, unlike multiglandular or non-localizing disease, which may call for bilateral neck exploration. Minimally invasive thyroidectomy is associated with lower morbidity and complications than bilateral neck exploration.
References:
Bunch PM, Kelly HR. Preoperative Imaging Techniques in Primary Hyperparathyroidism. JAMA Otolaryngology–Head & Neck Surgery. 2018;144(10):929. doi:https://doi.org/10.1001/jamaoto.2018.1671
Zarei A, Karthik S, Chowdhury FU, Patel CN, Scarsbrook AF, Vaidyanathan S. Multimodality imaging in primary hyperparathyroidism. Clinical Radiology. 2022;77(6):e401-e416. doi:https://doi.org/10.1016/j.crad.2022.02.018
March 2023: Pyosalpinx/Tubo-ovarian abscess
History: A 30-year-old female presented to the Emergency Department with two weeks of lower abdominal pain. A contrast-enhanced CT of the abdomen and pelvis was performed, followed by pelvic ultrasound.
Findings:
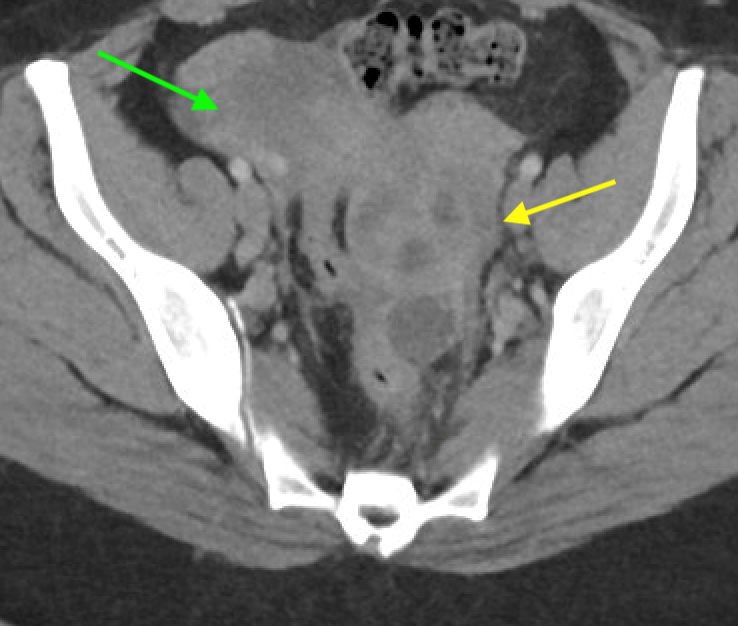
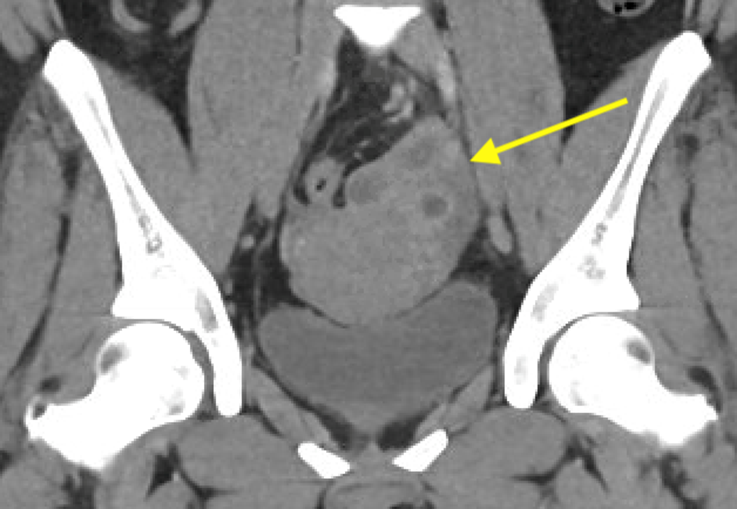
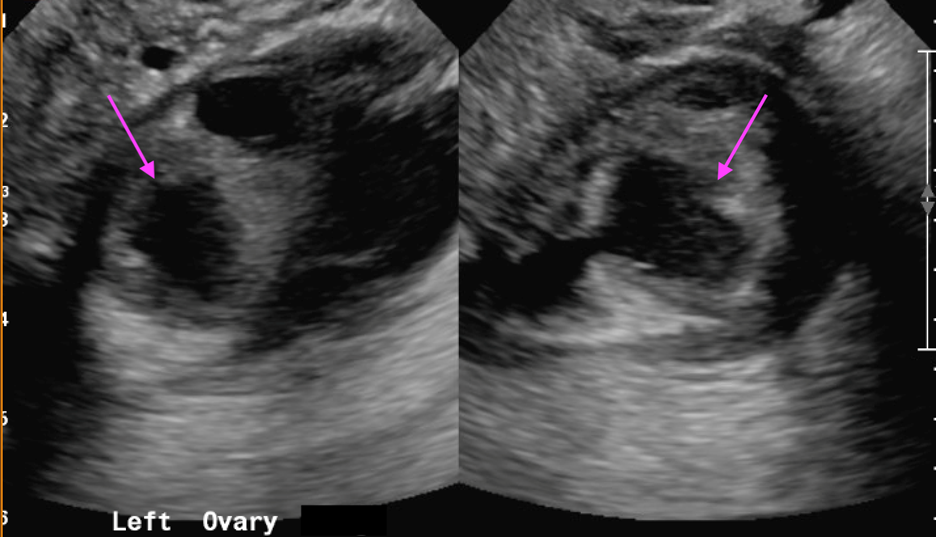
Axial and coronal contrast-enhanced images of the pelvis demonstrate a complex, multiloculated, elongated, fluid-filled tubular structure in the left adnexal region with associated wall thickening and mural enhancement (yellow arrows). The structure abuts the uterus and is associated with surrounding fat stranding. A thick-walled cystic structure is identified in the right ovary (green arrow).
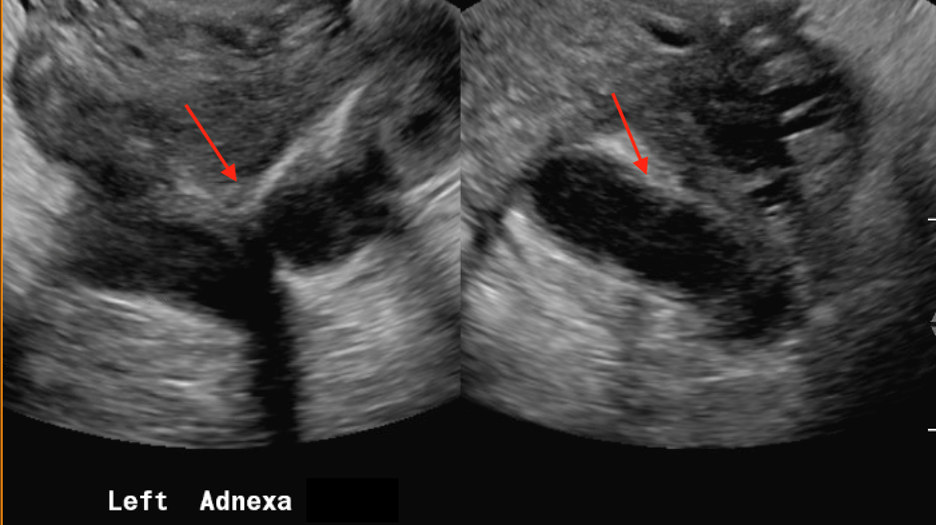
Follow-up pelvic ultrasound of the left adnexa demonstrates a complex left tubular structure (red arrows) and a left ovary containing a few complex cystic structures (see purple arrows, for example). Similar findings are noted in the right adnexa (not shown).
Diagnosis: Pyosalpinx/Tubo-ovarian abscess
Teaching Points:
Pyosalpinx and tubo-ovarian abscess are part of a spectrum of disease known as pelvic inflammatory disease (PID). PID is an ascending infection of the female genital tract often caused by sexually transmitted diseases. Risk factors including multiple sexual partners, gynecological surgery, and existing intrauterine device, amongst others. It can manifest as salpingitis, pyosalpinx, and tubo-ovarian complex/abscess (in order of progression). Some patients are asymptomatic, while others present with symptoms such as pelvic pain or vaginal discharge. Broadly, ultrasound is the best modality to evaluate female pelvic pathology, including PID.
Salpingitis is the earliest stage of PID. Sonographic findings may include thickening of the fallopian tube and mural hyperemia upon color Doppler assessment, although ultrasound can often be negative as well. CT/MRI may demonstrate fallopian tube mural thickening and mucosal enhancement. Associated free fluid may be seen.
Pyosalpinx occurs when pus accumulates in the fallopian tubes. As in the above case, ultrasound demonstrates debris-filled, dilated fallopian tubes characterized by low-amplitude echoes. Doppler assessment reveals mural hyperemia of the fallopian tubes. CT demonstrates a tubular mass-like structure adjacent to the uterus. Surrounding inflammatory change supports the diagnosis. On MRI, findings include dilated fallopian tubes with high signal intensity on T2-weighed imaging. Depending on the protein content of the fallopian tubes, T1-weighted imaging may demonstrate varying intraluminal signal.
Tubo-ovarian abscess occurs when infection involves the ovaries and peritoneal cavity, such that the ovaries and fallopian tubes become indistinguishable. Ultrasound may demonstrate a complex mixed cystic/solid adnexal mass, similar to the above case. MRI demonstrates T2-hyperintense cystic spaces and rim-enhancement of the adnexal mass.
A known complication of PID is Fitz-Hugh-Curtis syndrome, which occurs when infection spreads into the right paracolic gutter and right upper quadrant peritoneal structures. On CT, this manifests as thickening and enhancement of the liver capsule and intrahepatic perfusional variation. Chronic PID is characterized by hydrosalpinx, when there is distension of the fallopian tubes with fluid.
The mainstay of treatment of PID is appropriate antibiotic administration. In the setting of tubo-ovarian abscess, surgical intervention and/or drainage may be necessary.
References:
Chappell CA, wiesenfeld HC. Pathogenesis, Diagnosis, and Management of Severe Pelvic Inflammatory Disease and Tuboovarian Abscess. Clinical Obstetrics and Gynecology. 2012;55(4):893-903. doi:https://doi.org/10.1097/grf.0b013e3182714681
Revzin MV, Moshiri M, Katz DS, Pellerito JS, Mankowski Gettle L, Menias CO. Imaging Evaluation of Fallopian Tubes and Related Disease: A Primer for Radiologists. RadioGraphics. 2020;40(5):1473-1501. doi:https://doi.org/10.1148/rg.2020200051
Rezvani M, Shaaban AM. Fallopian Tube Disease in the Nonpregnant Patient. RadioGraphics. 2011;31(2):527-548. doi:https://doi.org/10.1148/rg.312105090
February 2023: Appendiceal Mucocele/Mucinous Appendiceal Neoplasm
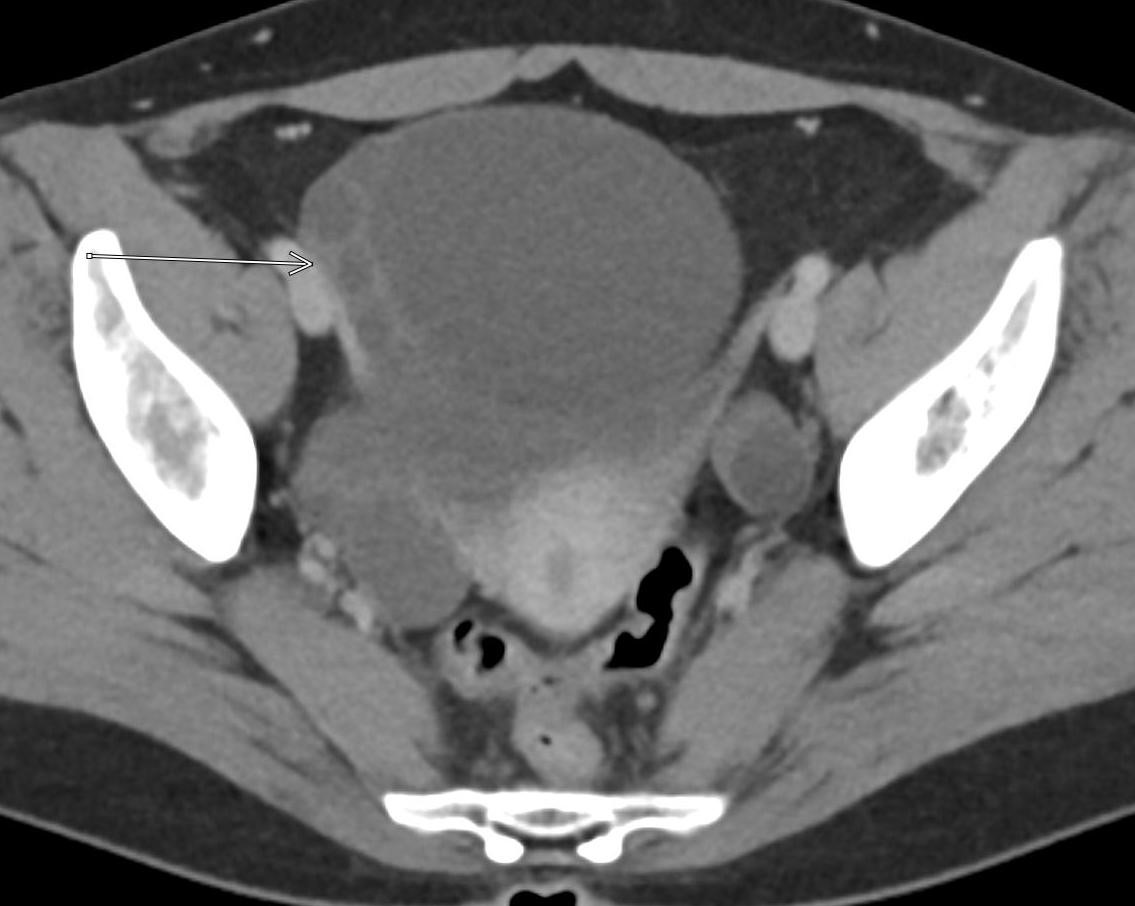
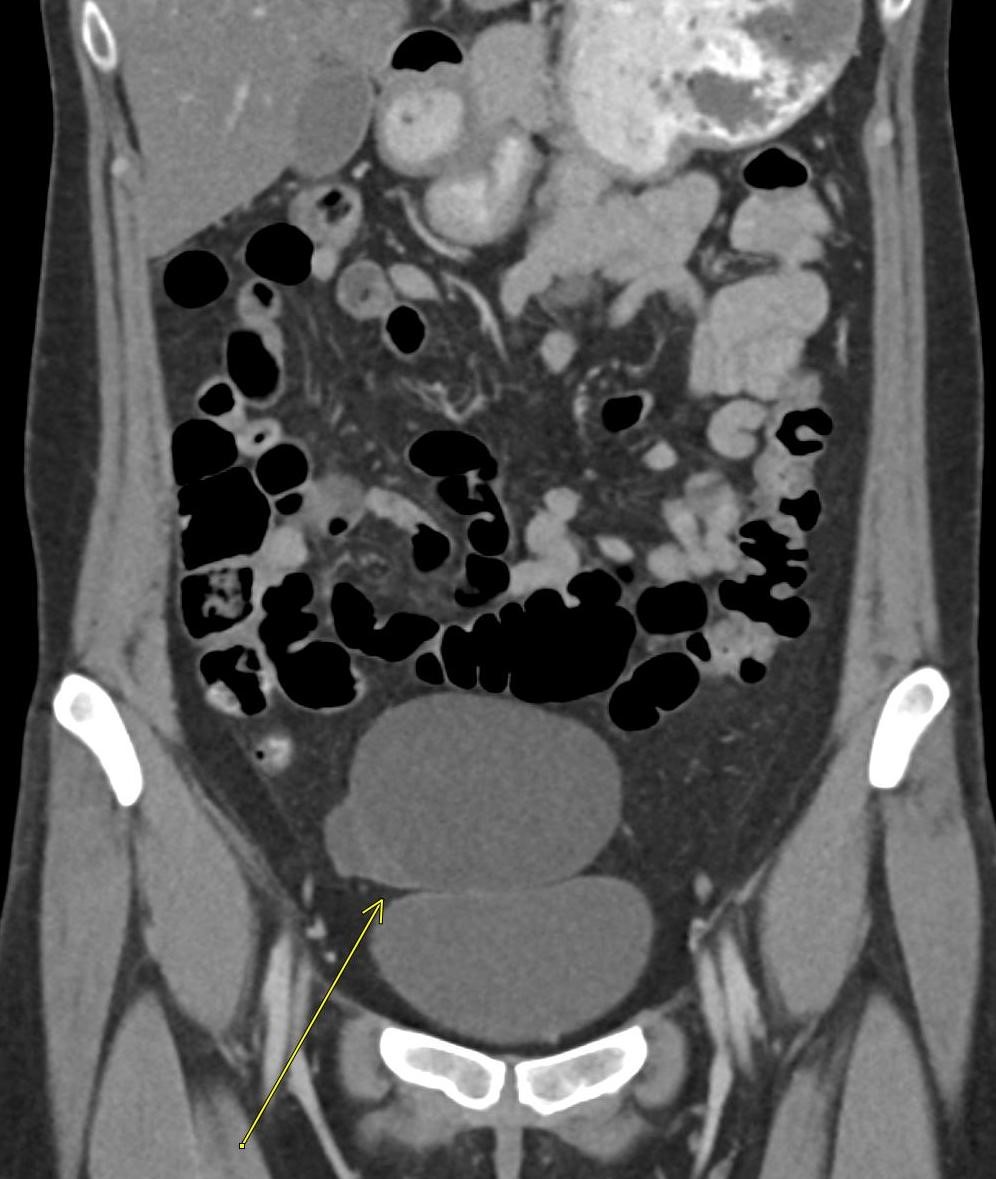
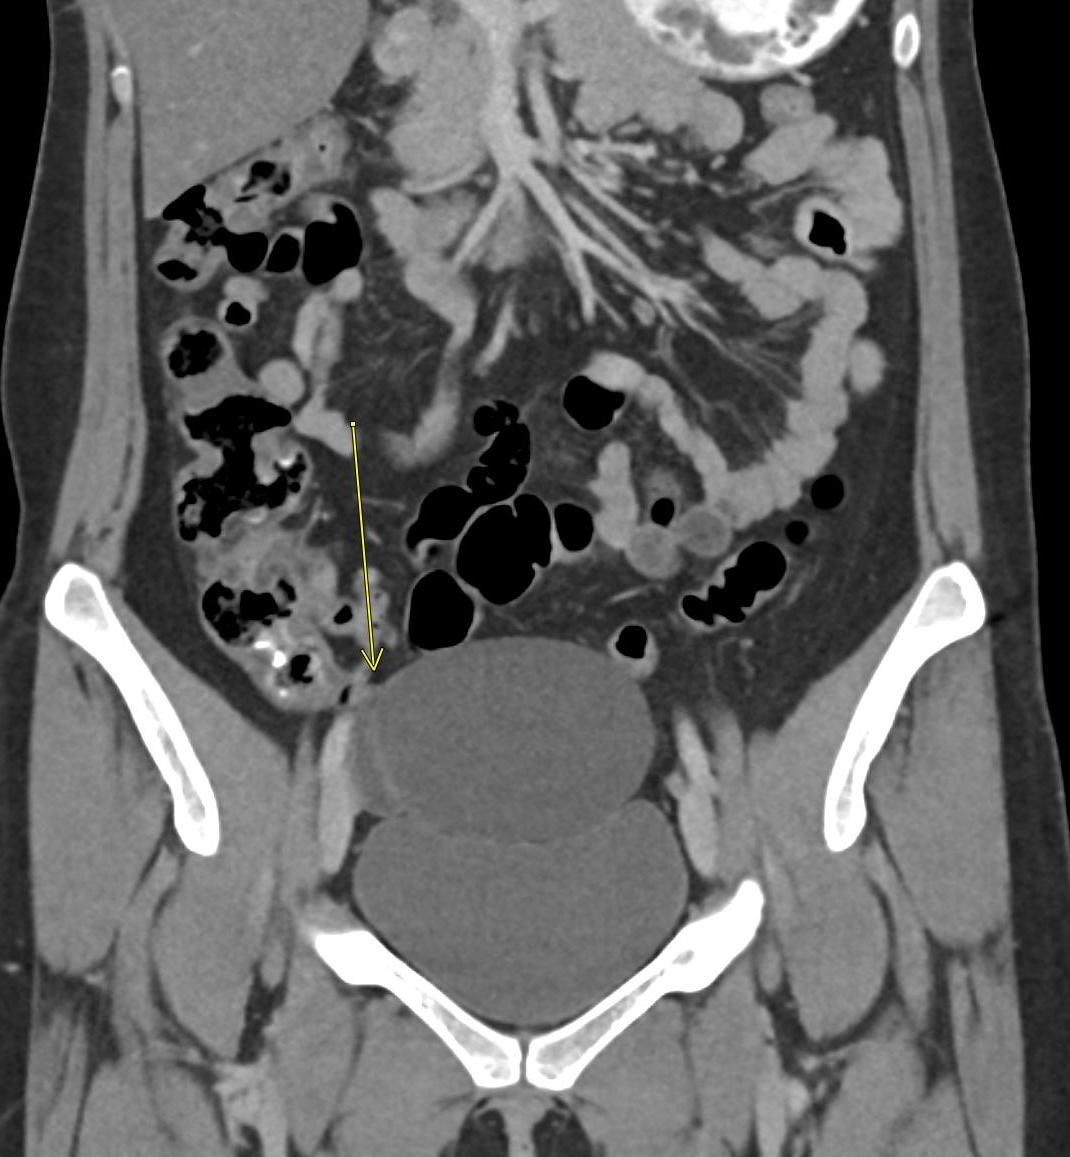
History: A 70-year-old female presented to the urologist for hematuria. A triphasic CT was performed for further evaluation. An incidental finding was made on this examination.
Findings:
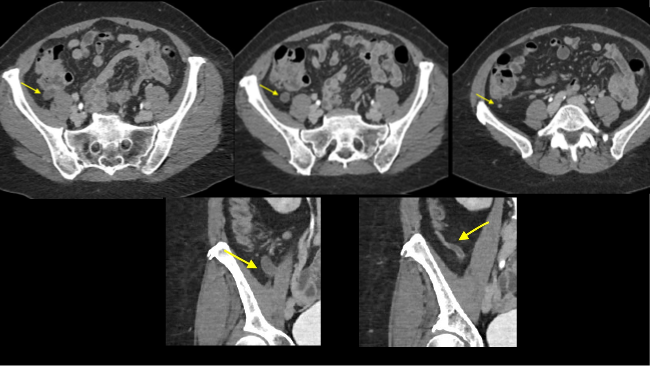
Sequential axial images of the lower abdomen progressing from superiorly to inferiorly (left to right in the top row) and sequential coronal images of the right lower quadrant progressing anteriorly to posteriorly (left to right in the bottom row) demonstrate dilatation of the appendix to 1.2 cm at its base with gradual tapering to normal caliber at the appendiceal tip (yellow arrows). The proximal appendix is filled with fluid density material. There is no periappendiceal fat stranding or appendiceal hyperenhancement to suggest appendicitis. Findings raise suspicion for an appendiceal mucocele, with appendiceal neoplasm not excluded. The patient was referred for surgical consultation, prompting laparoscopic appendectomy with partial cecectomy. Final pathology was consistent with a low-grade appendiceal mucinous neoplasm (LAMN).
Diagnosis: Appendiceal mucocele/mucinous appendiceal neoplasm
Teaching Points:
The specific histologic diagnosis in the above case, low-grade appendiceal mucinous neoplasm (LAMN), belongs to the broad pathologic category of appendiceal mucoceles, which comprises both benign and malignant entities. “Mucocele” refers to an appendix that is filled with mucus. Non-neoplastic etiologies of mucoceles include mucosal hyperplasia and retention cysts. Neoplastic etiologies include mucinous adenoma, low-grade appendiceal mucinous neoplasm (LAMN), and mucinous adenocarcinoma. The non-neoplastic etiologies have no potential for metastasis or pseudomyxoma peritonei. Amongst the neoplastic etiologies, mucinous adenoma is typically benign. Meanwhile, LAMN and mucinous adenocarcinoma have the potential to cause pseudomyxoma peritonei as well as hematogenous/nodal metastases. Approximately half of all patients with appendiceal mucoceles are asymptomatic, while the remainder may have a variety of nonspecific presentations. The larger group of epithelial appendiceal neoplasms (including both mucinous and non-mucinous subtypes) are found in the 5th-7th decades of life.
Appendiceal mucoceles are often found on CT. CT typically demonstrates a hypoattenuating tubular structure in the expected region of the appendix, as in the above case. There is usually an enhancing wall of variable thickness. Calcifications are variably present. Surrounding inflammatory changes or abscesses are not seen, excluding appendicitis as a differential diagnosis. MRI typically demonstrates a T2 hyperintense, T1 hypointense mass near the appendix. While both CT and MRI can demonstrate pseudomyxoma peritonei, MRI has better detection by means of diffusion weighted sequences and delayed gadolinium-enhanced T1 fat-saturation. In general, the imaging features cannot predict the risk of malignancy.
Imaging can sometimes reveal an inverted configuration of a mucocele extending into the cecum. Mucoceles infrequently cause small bowel obstructions related to rupture or extrusion of mucin amongst other etiologies. Even more rarely, they can result in intussusception. A potential complication of appendiceal mucoceles is pseudomyxoma peritonei, in which mucin fills the peritoneum and coats the serosa of the organs. This has variable imaging features, including mucinous ascites, peritoneal deposits/implants, and omental caking.
The treatment of appendiceal mucoceles is surgical resection. The surgical approach depends on the tumor, node, and metastasis (TNM) staging. Importantly, this staging system is distinct from that of colorectal adenocarcinoma.
References:
Leonards LM, Pahwa A, Patel MK, Petersen J, Nguyen MJ, Jude CM. Neoplasms of the Appendix: Pictorial Review with Clinical and Pathologic Correlation. RadioGraphics. 2017;37(4):1059-1083. doi:10.1148/rg.2017160150
Van Hooser A, Williams TR, Myers DT. Mucinous appendiceal neoplasms: pathologic classification, clinical implications, imaging spectrum and mimics. Abdominal Radiology. 2018;43(11):2913-2922. doi:10.1007/s00261-018-1561-9
January 2023: Cavernous Malformation with Developmental Venous Anomaly
History: A 30-year-old female presented to the primary care physician for headache. Noncontrast CT of the brain was obtained to assess for acute intracranial pathology. CT findings prompted evaluation with an MRI of the brain.
Findings:
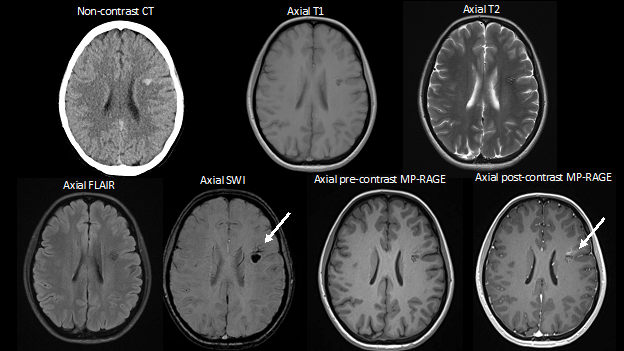
Axial non-contrast CT demonstrates a focal area of hyperattenuation in the left corona radiata without significant associated mass effect, findings which raise concern for a small parenchymal hematoma versus cavernous malformation. MRI with and without contrast is thus obtained for further evaluation. Subsequent MRI demonstrates a popcorn-like lesion with mixed T1 and T2 intensity, T2 hypointense hemosiderin rim, and associated gradient susceptibility on SWI centered in the left frontal lobe in the corona radiata, corresponding to the hyperattenuating lesion on CT. FLAIR imaging does not demonstrate any associated edema. There is no finding to suggest recent hemorrhage. On the post-contrast MP-RAGE sequence, there are radially oriented vessels along the anterior aspect of the lesion with associated abnormality on SWI (white arrows).
Diagnosis: Cavernous malformation with developmental venous anomaly
Teaching Points: A cavernous malformation, also known as a cavernoma, is a slow-flow vascular malformation that occurs in the central nervous system. Cavernous malformations are made up of multiple endothelial-lined “caverns.” There is no normal intervening brain tissue. While some patients are asymptomatic, others present with intracranial hemorrhage, headache, seizures, or focal neurological deficits. In about one third of cases, cavernous malformations are associated with developmental venous anomalies (DVA), which are the most common type of intracranial vascular malformation. DVAs drain normal brain parenchyma and are comprised of multiple venules that coalesce into a venous trunk that often ultimately drains into a dural sinus.
Cavernomas are challenging to identify on CT. They are also angiographically occult lesions, although catheter angiography may sometimes identify associated abnormal venous flow. Overall, MRI is the best modality in diagnosing cavernomas. A combination of histopathology and MRI categorize cavernomas into four different types. Type 2 cavernomas are the most common. These lesions have a “popcorn” appearance with heterogeneous T1 and T2 signal and a T2 hypointense rim. The internal signal characteristics are related to different ages of internal thrombosis and loculated hemorrhagic products. The T2 hypointense rim is related to peripheral deposition of hemosiderin after it has been cleared from the center of the lesion. With the exception of hemorrhagic lesions, cavernomas typically do not cause significant mass effect. Surrounding vasogenic edema is usually related to hemorrhage.
T2*-weighted gradient recall echo (GRE) and susceptibility weighted imaging (SWI) are important in diagnosis because they not only delineate the cavernoma but also potentially an associated DVA, as in the above case. DVA’s are characterized by a classic “medusa-head” appearance caused by a dominant transcortical venous flow void and multiple associated collecting veins. Contrast-enhanced MRI can also be useful in identifying a DVA associated with a cavernoma, as in the above case.
In most cases of cavernous malformation, there is a single, isolated cavernoma. However, a small number of patients have an inherited genetic disease known as hereditary/familial cerebral cavernous malformations, characterized by multiple cavernomas.
Solitary cavernomas are sometimes surgically resected if they cause seizures or focal neurological deficits, while management of multiple lesions in hereditary cases is more controversial.
References:
Batra S, Lin D, Recinos PF, Zhang J, Rigamonti D. Cavernous malformations: natural history, diagnosis and treatment. Nature Reviews Neurology. 2009;5(12):659-670. doi:10.1038/nrneurol.2009.177
Das K, Rangari K, Singh S, Bhaisora K, Jaiswal A, Behari S. Coexistent cerebral cavernous malformation and developmental venous anomaly: Does an aggressive natural history always call for surgical intervention? Asian Journal of Neurosurgery. 2019;14(1):318. doi:10.4103/ajns.ajns_196_18
Flemming KD, Kumar S, Brown RD, Lanzino G. Predictors of Initial Presentation with Hemorrhage in Patients with Cavernous Malformations. World Neurosurgery. 2020;133:e767-e773. doi:10.1016/j.wneu.2019.09.161
Kearns KN, Chen CJ, Yagmurlu K, et al. Hemorrhage Risk of Untreated Isolated Cerebral Cavernous Malformations. World Neurosurgery. 2019;131:e557-e561. doi:10.1016/j.wneu.2019.07.222
Vilanova JC, Barceló J, Smirniotopoulos JG, et al. Hemangioma from Head to Toe: MR Imaging with Pathologic Correlation. RadioGraphics. 2004;24(2):367-385. doi:10.1148/rg.242035079
Zafar A, Quadri SA, Farooqui M, et al. Familial Cerebral Cavernous Malformations. Stroke. 2019;50(5):1294-1301. doi:10.1161/strokeaha.118.022314
December 2022: Metastatic Pulmonary Calcification
History: A 55-year-old male with end stage renal disease presented for kidney transplant evaluation. Noncontrast CT of the abdomen and pelvis was obtained and included portions of the lower chest.
Findings: Axial noncontrast CT of the chest demonstrates diffuse centrilobular groundglass opacities in both lungs with sparing of the pleural surfaces and interlobular septal regions. Note is also made of mild cardiomegaly, aortic valve calcifications, and extensive calcific coronary artery atherosclerosis.
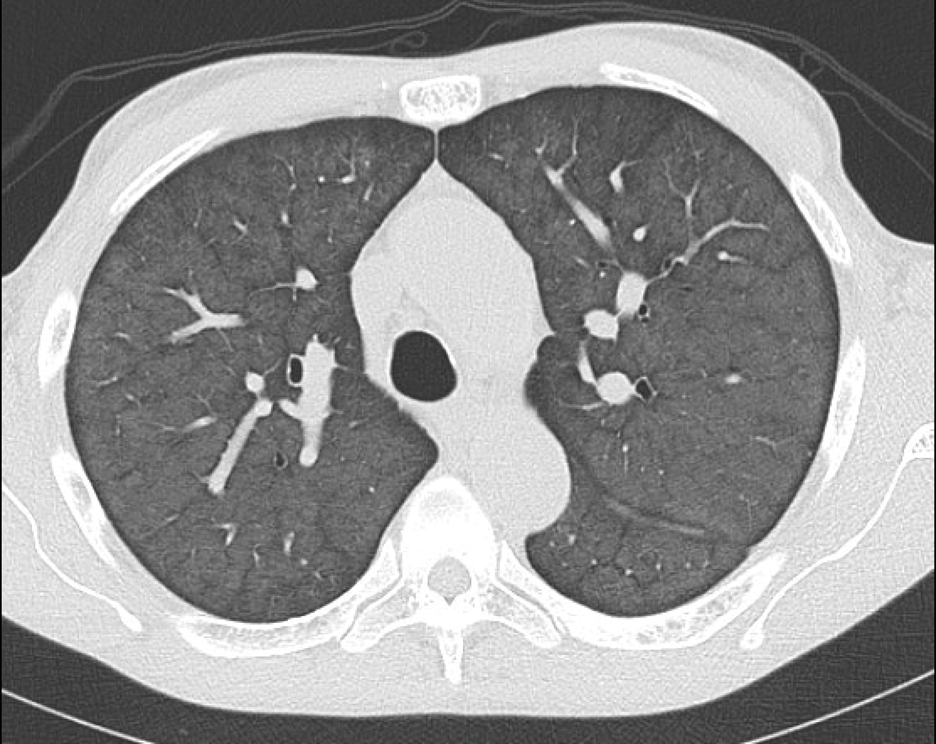
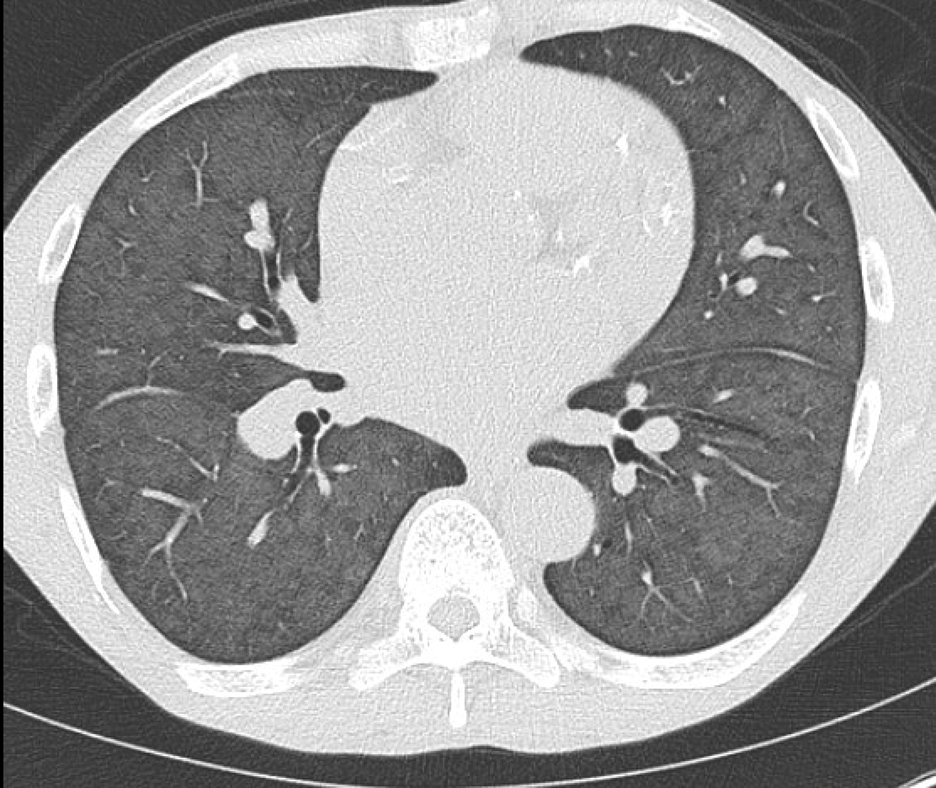
Diagnosis: Metastatic pulmonary calcification
Teaching Points: Metastatic pulmonary calcification (MPC) is a complication of end stage renal disease. It occurs when calcium deposits inside alveolar septa and the walls of small pulmonary vessels and bronchioles. This can be seen in patients with chronic renal failure, primary hyperparathyroidism, and milk-alkali syndrome, amongst other etiologies. Some patients are asymptomatic, while others may develop respiratory failure. MPC usually develops gradually.
Chest radiographs can be normal or depict airspace disease consistent with pneumonia or pulmonary edema. While chest radiographs have very limited sensitivity in demonstrating the calcification associated with MPC, CT proves very useful. One of the most common CT manifestations of MPC is centrilobular ground glass nodular opacities, which frequently contain calcifications. Other manifestations include dense consolidation or solid nodules that may be calcified. An upper lung predominance has been reported. An important associated finding of MPC includes vessel calcification in the chest wall.
Differential diagnostic considerations may include alveolar microlithiasis, infections such as tuberculosis, silicosis, coal workers’ pneumoconiosis, and talcosis.
Although MPC usually does not require intervention, phosphate and calcium normalization are usually targeted. In MPC related to chronic renal failure, parathyroidectomy, renal transplant, or dialysis may prove beneficial.
References:
Belém LC, Souza CA, Souza Jr. AS, et al. Metastatic pulmonary calcification: high-resolution computed tomography findings in 23 cases. Radiologia Brasileira. 2017;50(4):231-236. doi:10.1590/0100-3984.2016-0123
Belém LC, Zanetti G, Souza AS, et al. Metastatic pulmonary calcification: State-of-the-art review focused on imaging findings. Respiratory Medicine. 2014;108(5):668-676. doi:10.1016/j.rmed.2014.01.012
Chung MJ, Lee KS, Franquet T, Müller NL, Han J, Kwon OJ. Metabolic lung disease: imaging and histopathologic findings. European Journal of Radiology. 2005;54(2):233-245. doi:10.1016/j.ejrad.2004.07.003
Hartman TE, Müller NL, Primack SL, et al. Metastatic pulmonary calcification in patients with hypercalcemia: findings on chest radiographs and CT scans. American Journal of Roentgenology. 1994;162(4):799-802. doi:10.2214/ajr.162.4.8140993
November 2022: Osteoid Osteoma
History: A 12-year-old male presented to his primary care office with right leg pain for a few weeks. Further workup was performed, including radiographs of the right femur followed by an MRI of the pelvis.
Findings:
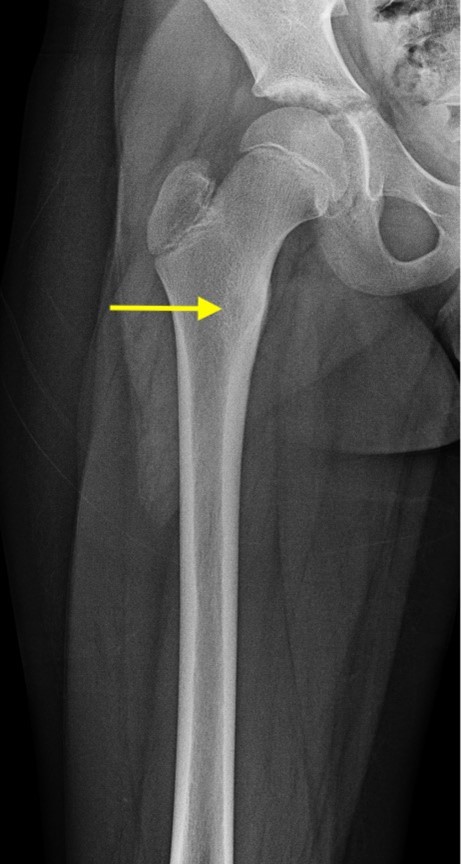
AP radiograph of the right femur shows mild sclerosis of the medial proximal femur with a subtle central lucent nidus (yellow arrow). No acute fracture is identified.
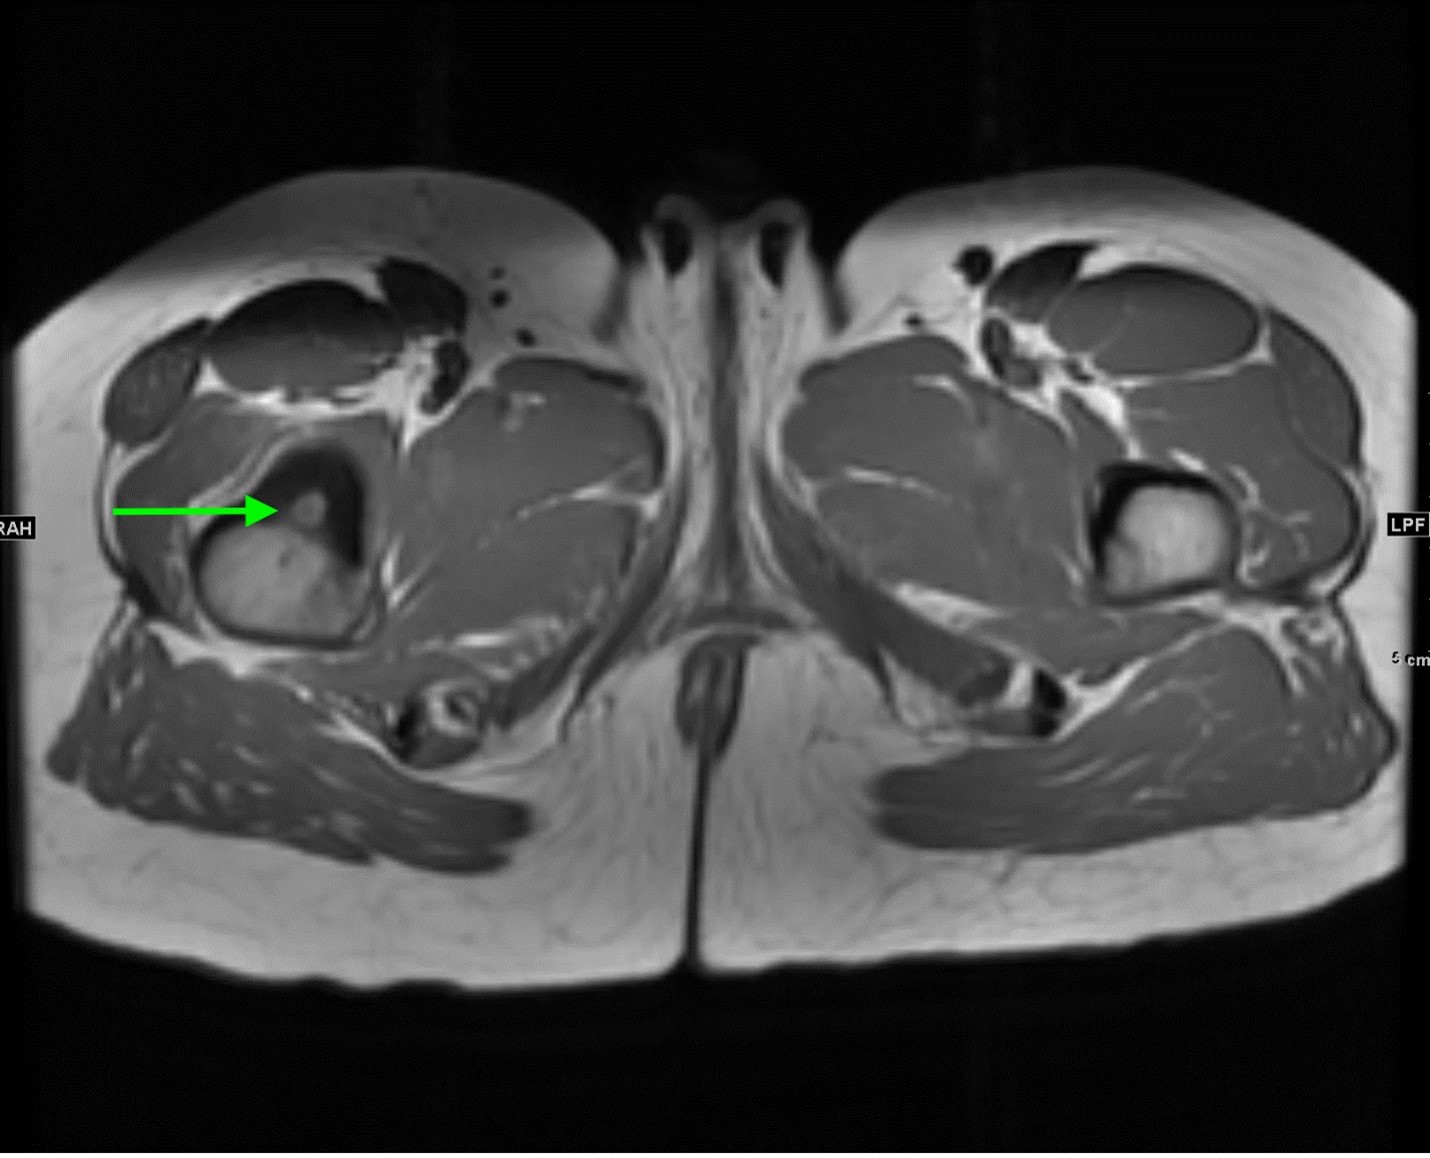
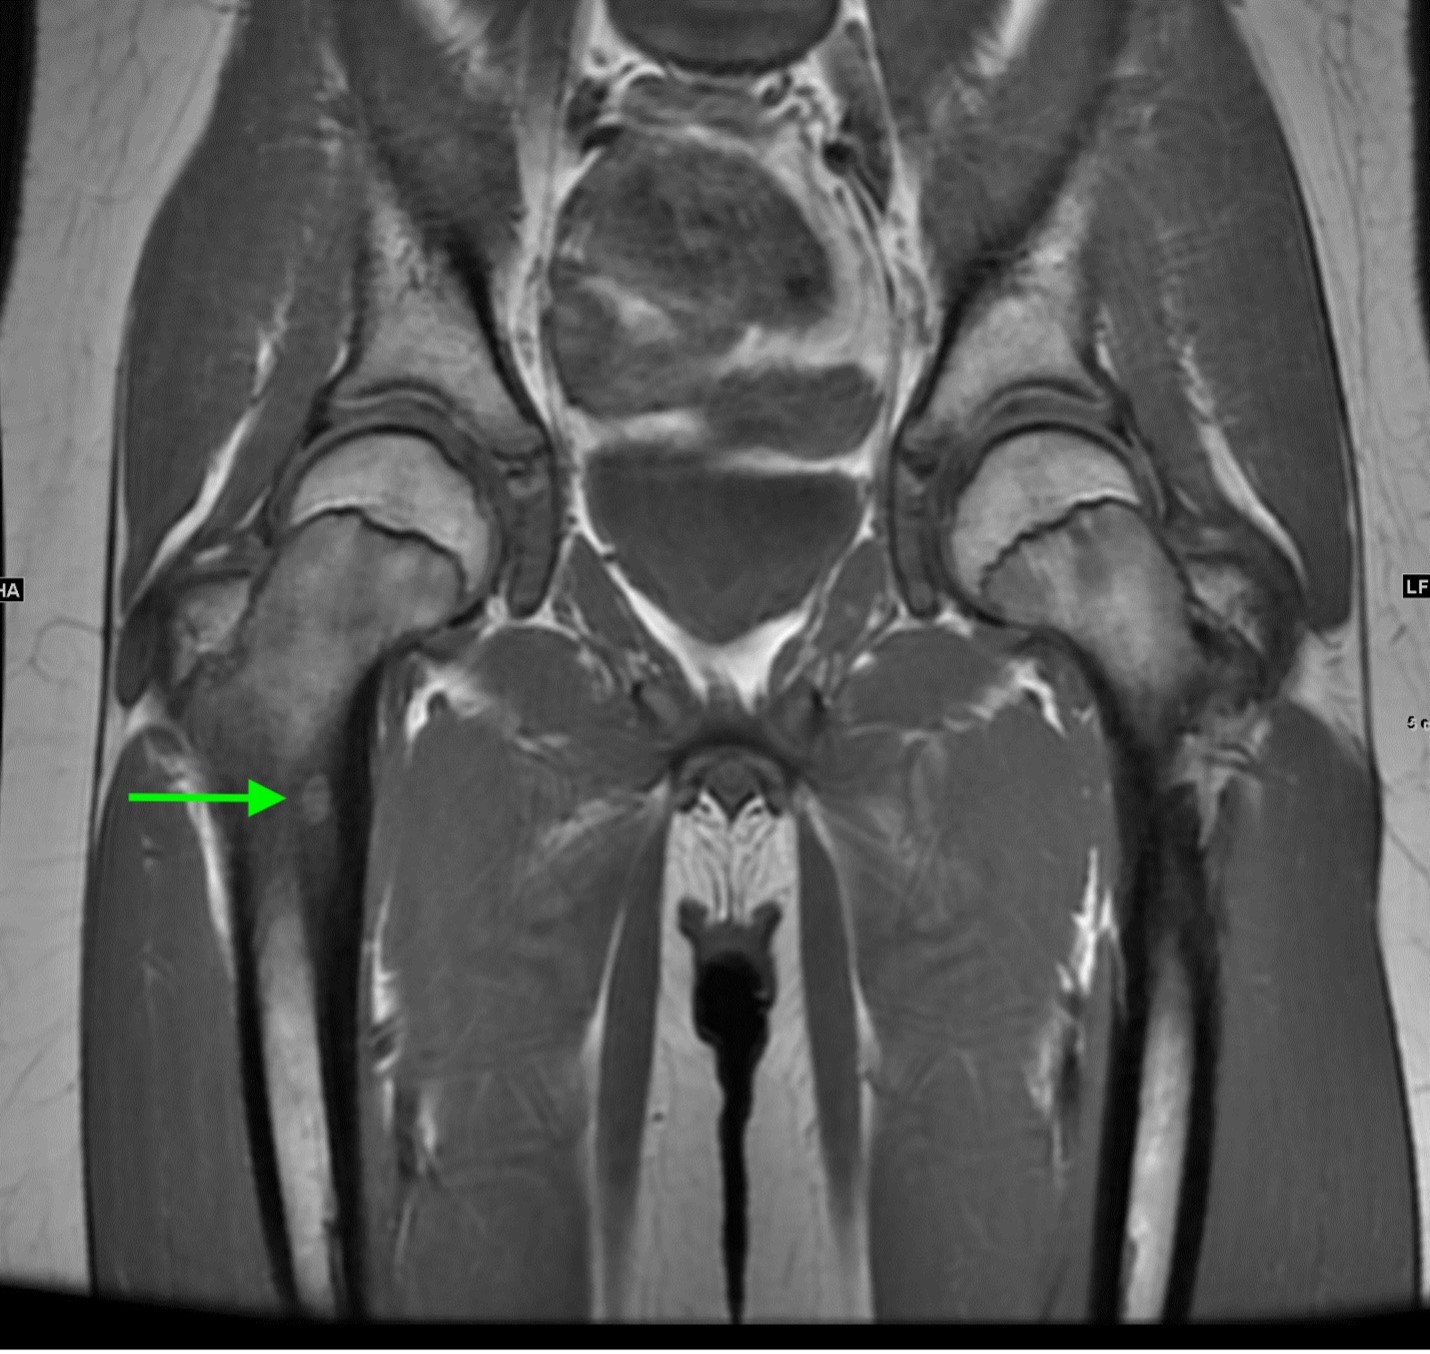
Axial and coronal T1 weighted images of the pelvis demonstrate a targetoid nidus with central T1 hypointensity compatible with calcification centered in the medial proximal right femur (green arrows). There is moderate cortical thickening surrounding the lesion. There is no evidence for fracture.
Coronal STIR images of the pelvis show extensive edema within the bone marrow surrounding the nidus extending from the proximal metaphysis to the proximal diaphysis of the right femur (teal arrow).
Diagnosis: Osteoid osteoma
Teaching Points: Osteoid osteomas are benign skeletal lesions characterized by a nidus of osteoid tissue associated with cortical thickening, marrow edema, and sclerosis. They have a predilection for males ranging from 7 to 25 years of age. Classically, patients complain of nighttime pain that is relieved by NSAIDS/aspirin. Symptoms often occur over weeks to years before patients present to a clinician.
One of the classification schemes for osteoid osteomas divides lesions into the following categories: subperiosteal, intracortical, endosteal, and intramedullary. Osteoid osteomas can occur in almost any bone, although they are most commonly found in the long bones (particularly femur and tibia).
On radiographs, osteoid osteomas are characterized by a round/oval nidus measuring less than 2 cm that demonstrates varying degrees of calcification. There may be associated cortical thickening and sclerosis. The sensitivity of radiographs largely depends on the location of the lesion. For example, cortical lesions will often have a radiolucent nidus with surrounding sclerosis, whereas intramedullary lesions demonstrate almost no sclerosis.
CT is excellent for identifying the nidus when radiographs are not revealing. It also appears to be superior to MRI in identifying the nidus. On CT, there is a low attenuation round/oval nidus that sometimes has high attenuation internally related to mineralization. Varying degrees of sclerosis are associated with the nidus.
On MRI, there is low/intermediate signal intensity on T1 weighted images and low to high signal intensity on T2 weighted images corresponding to different degrees of mineralization in the nidus. Sometimes, this may result in a target-like appearance. There is associated marrow edema. Effusions may be seen in the joints and soft tissues.
Important differential considerations for osteoid osteoma include stress fractures, intracortical abscess, osteoblastoma, and compensatory hypertrophy of the contralateral pedicle with unilateral spondylolysis, amongst others.
Some patients and clinicians may prefer conservative, noninterventional management for osteoid osteomas. Interventional management options include en bloc surgical resection of the osteoid osteoma nidus and image guided approaches including cryoablation, radiofrequency ablation, trephine excision, or laser thermocoagulation.
References:
Chai JW, Hong SH, Choi JY, et al. Radiologic Diagnosis of Osteoid Osteoma: From Simple to Challenging Findings. RadioGraphics. 2010;30(3):737-749. doi:10.1148/rg.303095120
Greenspan A. Benign bone-forming lesions: osteoma, osteoid osteoma, and osteoblastoma. Skeletal Radiology. 1993;22(7). doi:10.1007/bf00209095
Noordin S, Allana S, Hilal K, et al. Osteoid osteoma: Contemporary management. Orthopedic Reviews. 2018;10(3). doi:10.4081/or.2018.7496
Radcliffe SN, Walsh HJ, Carty H. Osteoid osteoma: the difficult diagnosis. European Journal of Radiology. 1998;28(1):67-79. doi:10.1016/s0720-048x(97)00071-5
October 2022: Acute Perforated Diverticulitis
History: An 80-year-old male presented to the Emergency Department with abdominal pain. A contrast-enhanced CT of the abdomen and pelvis was obtained for further evaluation.
Findings:
Axial and coronal CT images of the abdomen/pelvis in soft tissue window demonstrate colonic diverticulosis with marked bowel wall thickening and perifascial thickening and surrounding fat stranding (yellow arrows). No definite intramural abscess is seen. There is no drainable fluid collection.
Sagittal CT image of the abdomen/pelvis in lung window demonstrates foci of free air in portions of the abdomen (red arrow).
Diagnosis: Acute perforated diverticulitis
Teaching Points: Diverticulitis refers to the acute inflammation of colon diverticula. Colonic diverticula likely form due to degeneration of the colonic mucosa and local increases in pressure, most commonly in the sigmoid colon. Eighty percent of patients develop diverticulosis by the age of 80; diverticulitis affects 10-25% of patients with diverticulosis. It is believed that diverticulosis progresses to diverticulitis in the context of fecal stasis when a fecalith becomes lodged within a diverticular neck. Diverticulitis can be complicated by perforation, peritonitis, abscess formation, and fistulae amongst other issues. Patients with diverticulitis typically present with left-sided abdominal pain, low grade fevers, and alterations of bowel movements.
Given the nonspecific nature of presenting symptoms, imaging plays an important role in confirming the diagnosis of diverticulitis. CT is highly sensitive and specific in diagnosis. It also demonstrates the extent of disease, ultimately guiding management. Previously, barium enema was used for diagnostic purposes but has been overwhelmingly replaced by CT. Ultrasound, while highly sensitive and specific, depends largely on sonographer expertise and is typically pursued when there is a contraindication to CT. MRI, while also highly sensitive and specific, has not been thoroughly studied and is not widely used.
Findings consistent with diverticulitis on CT include colonic wall thickening along with pericolic fat stranding and hyperemia. Eventually, there is associated thickening of retroperitoneal/peritoneal folds. Phlegmons can be identified as small enhancing masses near the site of inflammation. Abscesses are usually characterized by thick, hyperdense walls with internal hypodensity.
Perforation can be diagnosed when there are foci of extraluminal gas, best demonstrated on lung or bone windows, or in the presence of extraluminal contrast. During supine CT exams, free air is typically identified in nondependent portions of the abdomen. Sometimes, focal bowel wall discontinuity can be identified to suggest perforation.
The major differential consideration for colonic diverticulitis is perforated colon cancer. Colon cancer may be differentiated from diverticulitis by the presence of eccentric wall thickening and associated lymphadenopathy. However, colonoscopy should be performed in cases of uncomplicated diverticulitis when there are concerning CT features or in accordance with national screening guidelines. Colonoscopy should be performed in all cases of complicated diverticulitis.
Uncomplicated diverticulitis can typically be managed on an outpatient basis. For complicated cases, many patients can be managed nonoperatively with bowel rest and IV antibiotics with some abscesses benefiting from percutaneous drainage. For those patients who do not respond to nonoperative management, the typical course includes a Hartmann procedure or primary anastomosis with or without diversion.
References: You H, Sweeny A, Cooper ML, Von Papen M, Innes J. The management of diverticulitis: a review of the guidelines. Medical Journal of Australia. 2019;211(9):421-427. doi:10.5694/mja2.5027610.
Sessa B, Galluzzo M, Ianniello S, Pinto A, Trinci M, Miele V. Acute Perforated Diverticulitis: Assessment With Multidetector Computed Tomography. Seminars in Ultrasound, CT and MRI. 2016;37(1):37-48. doi:10.1053/j.sult.2015.10.003
Shin D, Rahimi H, Haroon S, et al. Imaging of Gastrointestinal Tract Perforation. Radiologic Clinics of North America. 2020;58(1):19-44. doi:10.1016/j.rcl.2019.08.004
September 2022: Dural Venous Sinus Thrombosis
History: A 60-year-old female presented to the Emergency Department with an ongoing headache for a few days. A non-contrast CT of the head was obtained for further evaluation.
Findings:
Coronal non-contrast CT of the head (shown above) demonstrates hyperdensity and expansion of the right transverse sinus with additional hyperdensity in the posterior half of the straight sinus and posterior third of the superior sagittal sinus (blue arrows). The left transverse sinus is comparatively lower in density (purple arrow). Additional areas of hyperdensity and expansion are noted in the torcula, right sigmoid sinus, and right jugular bulb (not shown). These findings are consistent with dural venous sinus thrombosis in the areas of hyperattenuation. A focal curvilinear hyperdensity along the right tentorial leaflet is suspicious for subdural hemorrhage or a thrombosed vein (green arrow). CT venogram was obtained to further investigate these findings.
Coronal and sagittal images from the CT venogram (shown below) demonstrate complete lack of opacification of the right transverse sinus, posterior half of the straight sinus, and posterior third of the superior sagittal sinus with partial filling defect in the mid third of the superior sagittal sinus. The left transverse sinus opacifies with contrast (orange arrow). Additional areas of complete non-opacification are noted in the torcula, right sigmoid sinus, right jugular bulb with partial filling defect in the right upper jugular vein (not shown).
The filling defects on the CT venogram correspond to areas of hyperdensity on the non-contrast exam, consistent with occlusive thrombosis of the right transverse sinus, sigmoid sinus, jugular bulb, torcula, posterior half of the straight sinus, and posterior third of the superior sagittal sinus with subocclusive thrombus in the mid third of the superior sagittal sinus and right upper jugular vein. Associated thrombosis is noted in a superficial vein along the right tentorial leaflet, corresponding to the curvilinear hyperdensity in this location on the non-contrast exam (yellow arrow).
Diagnosis: Dural venous sinus thrombosis
Teaching Points: Dural venous sinus thrombosis refers to the thrombotic occlusion of the intracranial dural sinuses. The dural venous sinuses are vascular structures located between the periosteal and meningeal layers of the dura and receive blood from throughout the brain. Risk factors for dural venous sinus thrombosis include pregnancy, oral contraceptives, mastoiditis or similar conditions, inherited prothrombotic states, malignancy, and myeloproliferative disorders amongst others. Patient presentation is typically delayed from onset of symptoms. Most commonly, patients present with acute headache.
Initial evaluation at the time of presentation usually includes non-contrast enhanced CT of the brain. On non-contrast enhanced CT, acute thrombosis is signaled by increased attenuation within the sinuses. As clot retracts, the concentration of red blood cells and hemoglobin increases, resulting in higher attenuation of the thrombus, usually around 60-90 Hounsfield Units. Elevated hemoglobin levels and polycythemia vera have been found to cause false positive results on non-contrast enhanced CT due to the intrinsic high attenuation of blood in these cases.
CT venography can be used to further evaluate for dural venous sinus thrombosis. During this procedure, contrast is injected and images are acquired after a fixed delay at which contrast is expected to opacify the relevant vessels. Any filling defects are suggestive of thrombosis.
Conventional MRI can be used to evaluate dural venous sinus thrombosis and demonstrates different appearances on T1-weighted imaging and T2-weighted/FLAIR imaging based on the characteristics of hemoglobin degradation. Gradient echo and susceptibility weighted sequences demonstrate blooming artifact during certain stages of thrombus evolution. MR venography is also useful in evaluating dural venous sinus thrombosis and can be performed with or without contrast.
Possible long-term complication of dural venous sinus thrombosis include dural arteriovenous fistulas and idiopathic intracranial hypertension. Treatment of this entity revolves around the initiation of anticoagulation.
References:
Buyck PJ ., De Keyzer F, Vanneste D, Wilms G, Thijs V, Demaerel P. CT Density Measurement and H:H Ratio Are Useful in Diagnosing Acute Cerebral Venous Sinus Thrombosis. American Journal of Neuroradiology. 2013;34(8):1568-1572. doi:10.3174/ajnr.a3469
Ghoneim A, Straiton J, Pollard C, Macdonald K, Jampana R. Imaging of cerebral venous thrombosis. Clinical Radiology. 2020;75(4):254-264. doi:10.1016/j.crad.2019.12.009
August 2022: Small Bowel Obstruction Due to Spigelian Hernia
History: A 70-year-old female presented to the Emergency Department with left lower quadrant abdominal pain and several episodes of emesis. A CT of the abdomen and pelvis was ordered for further evaluation.
Findings:
Axial and coronal images of the abdomen/pelvis demonstrate numerous loops of mildly dilated small bowel with fecalization of the small bowel contents (red arrows). There is a spigelian hernia in the left lower abdominal wall (yellow arrows). A transition point is identified in the distal ileum within the spigelian hernia (yellow arrows). The bowel loop entering the spigelian hernia is mildly dilated, the loop within the hernia is normal in caliber, while the exiting loop is collapsed. There is nonspecific thickening of the terminal ileum distal to the obstruction. A small amount of fluid is noted in the spigelian hernia sac, and there is a moderate amount of edema adjacent to the dilated loops of bowel.
Diagnosis: Small Bowel Obstruction Due to Spigelian Hernia
Teaching points: A spigelian hernia is a type of anterior abdominal wall hernia that occurs through the spigelian fascia, which is an aponeurosis between the rectus abdominis muscle and the semilunar line. Spigelian hernias often occur at or below the arcuate line, as there is no posterior rectus sheath at that level. They are also known as lateral ventral hernias.
Overall, spigelian hernias are rare, comprising 1-2% of all abdominal wall hernias. Most often, spigelian hernias are acquired, although children may present with congenital spigelian hernias. Risk factors for acquired spigelian hernias include but are not limited to morbid obesity, multiple pregnancies, COPD, and rapid weight loss. Spigelian hernias are usually small and high risk for strangulation.
Diagnosis of spigelian hernias can be quite challenging. Patients may present with nonspecific pain when they have a reducible hernia. Others present with a complication of the hernia, such as small bowel obstruction. Physical exam is usually not reliable in the diagnosis. The diagnosis is typically made on CT, which also allows physicians to determine the contents, location, and possible complications of the hernia.
On CT, a spigelian hernia is diagnosed when there is a fascial defect in the appropriate location, as described above. The hernia may contain fat, omentum, small bowel, and/or large bowel. Small bowel obstruction, when present, is diagnosed based on the presence of dilated proximal bowel and collapsed distal bowel with an intervening transition point.
Because of the high risk for strangulation, spigelian hernias are treated surgically. Open and laparoscopic techniques are used, with laparoscopic techniques demonstrating improved morbidity compared to open techniques.
References:
Harrison LA, Keesling CA, Martin NL, Lee KR, Wetzel LH. Abdominal wall hernias: review of herniography and correlation with cross-sectional imaging. RadioGraphics. 1995;15(2):315-332. doi:10.1148/radiographics.15.2.7761638
Martin M, Paquette B, Badet N, Sheppard F, Aubry S, Delabrousse E. Spigelian hernia: CT findings and clinical relevance. Abdominal Imaging. 2012;38(2):260-264. doi:10.1007/s00261-012-9889-z
Mustaffa N, Leong R, Katelaris P. Gastrointestinal: Spigelian hernia; an uncommon cause of longstanding intermittent abdominal pain. Journal of Gastroenterology and Hepatology. 2012;28(1):202-202. doi:10.1111/jgh.12027
Salameh JR. Primary and Unusual Abdominal Wall Hernias. Surgical Clinics of North America. 2008;88(1):45-60. doi:10.1016/j.suc.2007.10.004
July 2022: Emphysematous Cystitis
History: A 55-year-old female presented to the Emergency Department with hematuria. The patient was status post renal transplant two months prior to presentation. A CT of the abdomen and pelvis was ordered to evaluate for stones in the urinary tract.
Findings:
Axial and coronal images of the abdomen/pelvis demonstrate extensive submucosal and intraluminal air within the bladder (red arrows). Some of the air extends into the right lower quadrant renal allograft collecting system (yellow arrows). An Incidental note is made of hepatic steatosis. The native kidneys are atrophic.
Diagnosis: Emphysematous cystitis
Teaching points: Emphysematous cystitis is an infection of the bladder due to gas-forming bacteria, most commonly Escherichia coli and Enterobacter aerogenes. Important risk factors include diabetes, immunocompromised state, and neurogenic bladder. In diabetics, poor glycolysis within tissues results in excessive interstitial glucose, which is then fermented by certain bacteria, producing gas. Women are affected more than men. Patients may present with dysuria, increased urinary frequency, and/or hematuria. While some patients are asymptomatic, others can present with sepsis/septic shock. Emphysematous cystitis may be present alongside emphysematous pyelitis and emphysematous pyelonephritis.
CT is very sensitive for the detection of emphysematous cystitis and demonstrates intraluminal and intramural gas within the bladder. Radiographs may demonstrate curvilinear/mottled lucent areas in profile with the bladder. On radiographs, the appearance of emphysematous cystitis can mimic other entities such as emphysematous vaginitis or gas gangrene of the uterus. Ultrasound frequently shows mural thickening and increased echogenicity of the bladder, sometimes with foci of dirty shadowing. Noninfectious etiologies of intra-vesicular gas must be considered, including trauma, instrumentation, or fistulas with adjacent organs (specifically vesicovaginal or vesicocolic fistulas). CT cystography may be useful for identifying vesicocolic fistulas.
Treatment of emphysematous cystitis includes antibiotics, hyperglycemic control, and appropriate urinary drainage. If there is concomitant bladder outlet obstruction, this should be corrected.
References:
Grayson DE, Abbott RM, Levy AD, Sherman PM. Emphysematous Infections of the Abdomen and Pelvis: A Pictorial Review. RadioGraphics. 2002;22(3):543-561. doi:10.1148/radiographics.22.3.g02ma06543
Joseph RC, Amendola MA, Artze ME, et al. Genitourinary tract gas: imaging evaluation. RadioGraphics. 1996;16(2):295-308. doi:10.1148/radiographics.16.2.8966288
Ranjan SK, Navriya SC, Kumar S, Mittal A, Bhirud DP. Emphysematous cystitis: A case report and literature review of 113 cases. Urology Annals. 2021;13(3):312-315. doi:10.4103/UA.UA_61_20
Yu M, Robinson K, Siegel C, Menias C. Complicated Genitourinary Tract Infections and Mimics. Current Problems in Diagnostic Radiology. 2017;46(1):74-83. doi:10.1067/j.cpradiol.2016.02.004
May 23, 2022: Fallopian Tube Torsion
History: A 35-year-old female presented to the Emergency Department with right lower quadrant pain for 1 day. CT of the abdomen and pelvis was ordered due to concern for appendicitis.
Findings:
The coronal CT image of the abdomen and pelvis shows a large 9.0 cm simple-appearing right adnexal cyst.
Axial and coronal CT images of the abdomen and pelvis show a dilated, tubular, fluid-filled structure along the periphery of the right ovary with a beaked appearance, most consistent with a dilated fallopian tube. There is associated thickening and enhancement of the fallopian tube wall. The right ovary itself is slightly enlarged.
Diagnosis: Fallopian Tube Torsion
Teaching Points:
Fallopian tube torsion is a type of adnexal torsion and usually occurs in the setting of coexisting ovarian torsion, although isolated tubal torsion can occur. Twisting of the ovary and/or fallopian tube around its vascular pedicle (in the suspensory ligament) results in vascular compromise and potentially ovarian infarction. Initially, the ovarian vein and lymphatics are affected and result in engorgement and enlargement of the ovary. Eventually, if not treated quickly, the ovarian artery becomes compressed and results in ischemia/infarction. Complications of isolated fallopian tube torsion include fallopian tube necrosis or gangrenous transformation. Risk factors for tubal torsion include ovarian or paraovarian masses (especially if greater than 5 cm), adhesions, tubal ligation, pelvic inflammatory disease, and hydro/hematosalpinx. Interestingly, tubal torsion usually occurs on the right. Most patients present with severe acute abdominal pain and vomiting.
On CT, the typical findings suggestive of tubal torsion include an adnexal mass (such as the large adnexal cyst in our case shown above), and a dilated fallopian tube measuring greater than 15 mm in diameter, and associated thickening and enhancement of the fallopian tube wall. Often, the dilated fallopian tube takes on a “beaked” appearance where it tapers toward either end, similar to that seen in closed-loop bowel obstruction. Occasionally, there may also be intraluminal hyperdense material compatible with hemorrhage, not seen in our case. Secondary signs include free pelvic fluid, adjacent fat stranding, and thickening of the broad ligament. On ultrasound, there will be similar findings including a dilated fallopian tube with a thick, echogenic wall and internal debris. Twisting of the vascular pedicle is a specific finding though is not always seen.
If associated with ovarian torsion, as is usually the case, the ovary will be significantly enlarged. Due to the increase in size, the ovary does not have enough space in its usual location within the pelvis and migrates superiorly and anteriorly toward the midline, often positioned in front of the uterus. The uterus has then deviated toward the side of the affected ovary. It is important to remember that normal arterial waveforms within the ovary do not exclude the possibility of torsion, since arterial perfusion is maintained until late in the course of torsion.
Differential considerations based on the imaging appearance of a dilated fluid-filled structure include hydrosalpinx, hematosalpinx, and pyosalpinx. Early tubo-ovarian abscesses could also have a similar appearance.
Treatment is surgical detorsion. In addition, cystectomy is performed for benign lesions and salpingo-oopherectomy is often performed if there is concern for malignancy.
References:
- Dawood MT, et al. Adnexal Torsion: Review of Radiologic Appearances. Radiographics. 2021; 41(2).
- Gross M, et al. Isolated Fallopian Tube Torsion: A Rare Twist on a Common Theme. American Journal of Roentgenology. 2005; 185(6).
- Lourenco A, et al. Ovarian and tubal torsion: imaging findings on the US, CT, and MRI. Emergency Radiology. 2014; 21(2).
May 16, 2022: Transient Global Amnesia
History: A 50-year-old woman presented to the Emergency Department complaining of memory loss and “mental fog” since waking up that morning. Brain MRI was performed for further evaluation.
Findings:

Axial diffusion-weighted MR image of the brain demonstrates a punctate focus of diffusion restriction in the right hippocampus. There was a corresponding low-intensity signal on ADC images (not shown).


The remainder of the brain was unremarkable. No significant FLAIR signal hyperintensity was seen to suggest a background of microvascular ischemic disease.
Diagnosis: Transient Global Amnesia
Teaching Points:
Transient global amnesia is a rare clinical syndrome in which a patient experiences anterograde and partial retrograde short-term memory loss over a time period of less than 24 hours. Symptoms are transient and usually completely resolve within a few hours, and there are no other associated neurological symptoms. Long-term memory is usually preserved. The exact cause is unknown, but precipitating factors can include emotional/physical stress or pain.
Imaging is often performed to exclude other causes of amnesia, acute stroke, and structural abnormalities. On imaging, brain CT will usually be normal. MRI can show punctate regions of diffusion restriction in the hippocampus cornu ammonis 1 (CA1), located along the lateral edge of the hippocampus abutting the temporal horn. It can be unilateral or bilateral.
A differential consideration is a posterior circulation acute infarct. However, in cases of posterior circulation infarct that involve the hippocampus, the area of diffusion restriction is usually larger and associated with additional areas of restricted diffusion in the occipital lobe, thalamus, or corpus callosum.
No treatment is required for transient global amnesia. Outpatient follow-up is the standard management.
References:
- Vella S, Grech R. Highlighting the classical MRI findings in transient global amnesia. British Journal of Radiology Case Reports. 2020; 6(2).
- Jain TP, et al. Transient global amnesia: Diffusion MRI findings. Indian Journal of Radiology and Imaging. 2018; 28(1).
Szabo K, et al. Diffusion-weighted MRI in transient global amnesia and its diagnostic implications. Neurology. 2020: 95(2).
May 16, 2022: Benign lymphoepithelial lesions of HIV
History: A 35-year-old female with uncontrolled HIV presented to the Emergency Department with right-sided neck pain and swelling. The ED team was concerned about an abscess and ordered a CT soft tissue neck with contrast.
Findings:


Axial, coronal, and sagittal views of the neck show multiple well-circumscribed, rim-enhancing cystic lesions within the right parotid gland. Image #5 also shows that the left parotid gland is involved to a lesser degree compared to the right. The submandibular and sublingual glands were not involved.
Diagnosis: Benign lymphoepithelial lesions of HIV
Teaching Points:
Benign lymphoepithelial lesions (BLL) are mixed cystic and solid lesions within the parotid gland that usually occur in patients with HIV. Approximately 5% of HIV patients will develop these lesions, usually in uncontrolled patients. They only rarely occur with HAART therapy. BLL arise due to lymphoid hypertrophy causing obstruction and subsequent dilation of the intraglandular parotid ducts. As such, BLL are often seen along with hypertrophy of the nasopharyngeal adenoid tissue and cervical lymphadenopathy. While they most often affect the parotid glands, the submandibular and sublingual glands can also rarely be affected.
On imaging, BLL appear most often as well-circumscribed, rim-enhancing cystic lesions, as shown in our case above. Complex cystic masses with small septations and mural nodules are also common. They are usually unilateral but are bilateral in about 20% of cases. They are known to gradually increase in size over time and can involve the facial nerve.
Differential considerations for unilateral disease include sialolithiasis, 1st branchial cleft cyst, adenoid cystic carcinoma, and benign mixed tumor. For bilateral disease, the differential includes Sjogren’s disease, sarcoid, and lupus. Sjogren’s disease can have a very similar appearance and is also related to lymphoid infiltration in the parotid glands, with the end-stage form of the disease appearing as a “honeycomb” parotid gland with multiple small cystic lesions. The best way to differentiate BLL of HIV from Sjogren’s disease is by the cervical lymphadenopathy associated with BLL.
Treatment for BLL is usually aimed at improving control of the patient’s HIV rather than specifically directed at the BLL. However, follow-up is recommended because HIV-positive patients are at increased risk for development of malignant lymphoma, and any sudden increase in parotid gland size could be an indicator of malignancy.
References:
- Arutyunyan S, et al. Benign lymphoepithelial lesion of the parotid gland in the setting of HAART. Journal of the International Association of Providers of AIDS Care.
- Holliday RA, et al. Benign lymphoepithelial parotid cysts and hyperplastic cervical adenopathy in AIDS-risk patients: a new CT appearance. 1988; 168(2).
- Shivhare P, et al. Benign lymphoepithelial cysts of parotid and submandibular glands in a HIV positive patient. Journal of Oral and Maxillofacial Pathology. 2015; 19(1).
April 04, 2022: Developmental Dysplasia of the Hip
History: A 40-year-old woman presented to the Emergency Department with chronic right hip pain.

A coronal T1 image of the hips shows mild lateral uncovering of the right femoral head. Note the well-formed left femoral head seated within a well-formed left acetabulum.

A coronal T1 image of the hips shows a shallow right acetabulum.

Coronal oblique T2 fat-sat image of the right hip shows hypertrophy of the right acetabular labrum and prominence of the right pulvinar fat.

Coronal T1 image of the hips shows abnormal concavity along with the lateral right femoral head likely related to chronic altered biomechanics of the joint.


Coronal T1 image of the hips and sagittal T2 fat-sat image of the right hip shows moderate right hip osteoarthritis with superior joint space narrowing, superior acetabular subchondral cyst formation, full-thickness cartilage loss over the anterosuperior and superolateral femoral head, and femoral head osteophyte formation.

Sagittal T2 fat-sat image of the right hip shows degeneration and tearing of the anterosuperior acetabular labrum.
Diagnosis: Sequelae of Developmental Dysplasia of the Hip (DDH) with right acetabular dysplasia and moderate right hip osteoarthritis
Teaching Points:
This case shows the long-term sequelae of developmental dysplasia of the hip (DDH), a diagnosis most often made in newborns. If diagnosed early, many of these long-term manifestations can be prevented by placing the patient in a Pavlik harness. However, in this case, the patient went undiagnosed and developed early-onset osteoarthritis.
DDH most often occurs in females and is frequently associated with oligohydramnios and abnormal in utero positioning. Additional risk factors include firstborn babies, breech presentations, and family history. Clinically, these babies present with positive Ortolani tests and/or Barlow maneuvers.
Ultrasound is the initial imaging test of choice in newborns, and DDH will show an alpha angle <60 degrees (angle from the acetabular roof to the vertical cortex of the ilium).
In adolescents and adults, DDH eventually leads to acetabular dysplasia or a shallow acetabulum that leads to hip instability due to insufficient coverage of the femoral head, as seen in our case above. Acetabular dysplasia eventually leads to early-onset osteoarthritis, chondral and labral damage, subchondral fractures, and hip instability/subluxation.
Treatment options for adolescents and adults with acetabular dysplasia include the Salter periacetabular osteotomy to reorient the acetabulum in order to provide increased coverage for the femoral head and the
Pemberton acetabuloplasty to change the morphology of the acetabulum. In severe cases, total hip arthroplasty may be indicated.
References:
1. Okano K, et al. Relationship between developmental dislocation of the hip in infant and acetabular dysplasia at skeletal maturity. Medicine. 2015; 94(1): 268.
2. Beltran LS, et al. Imaging Evaluation of Developmental Hip Dysplasia in the Young Adult. Musculoskeletal Imaging. 2012; 200: 1077-1088.
3. Manaster, BJ. Adult Chronic Hip Pain: Radiographic Evaluation. Radiographics. 2000; 20(1): S3-S25.
March 14, 2022: Fenestral and Retrofenestral Otosclerosis
History: A 45-year-old male presents to the Neurologist with a chief complaint of gradual and progressive bilateral hearing loss.
Findings:
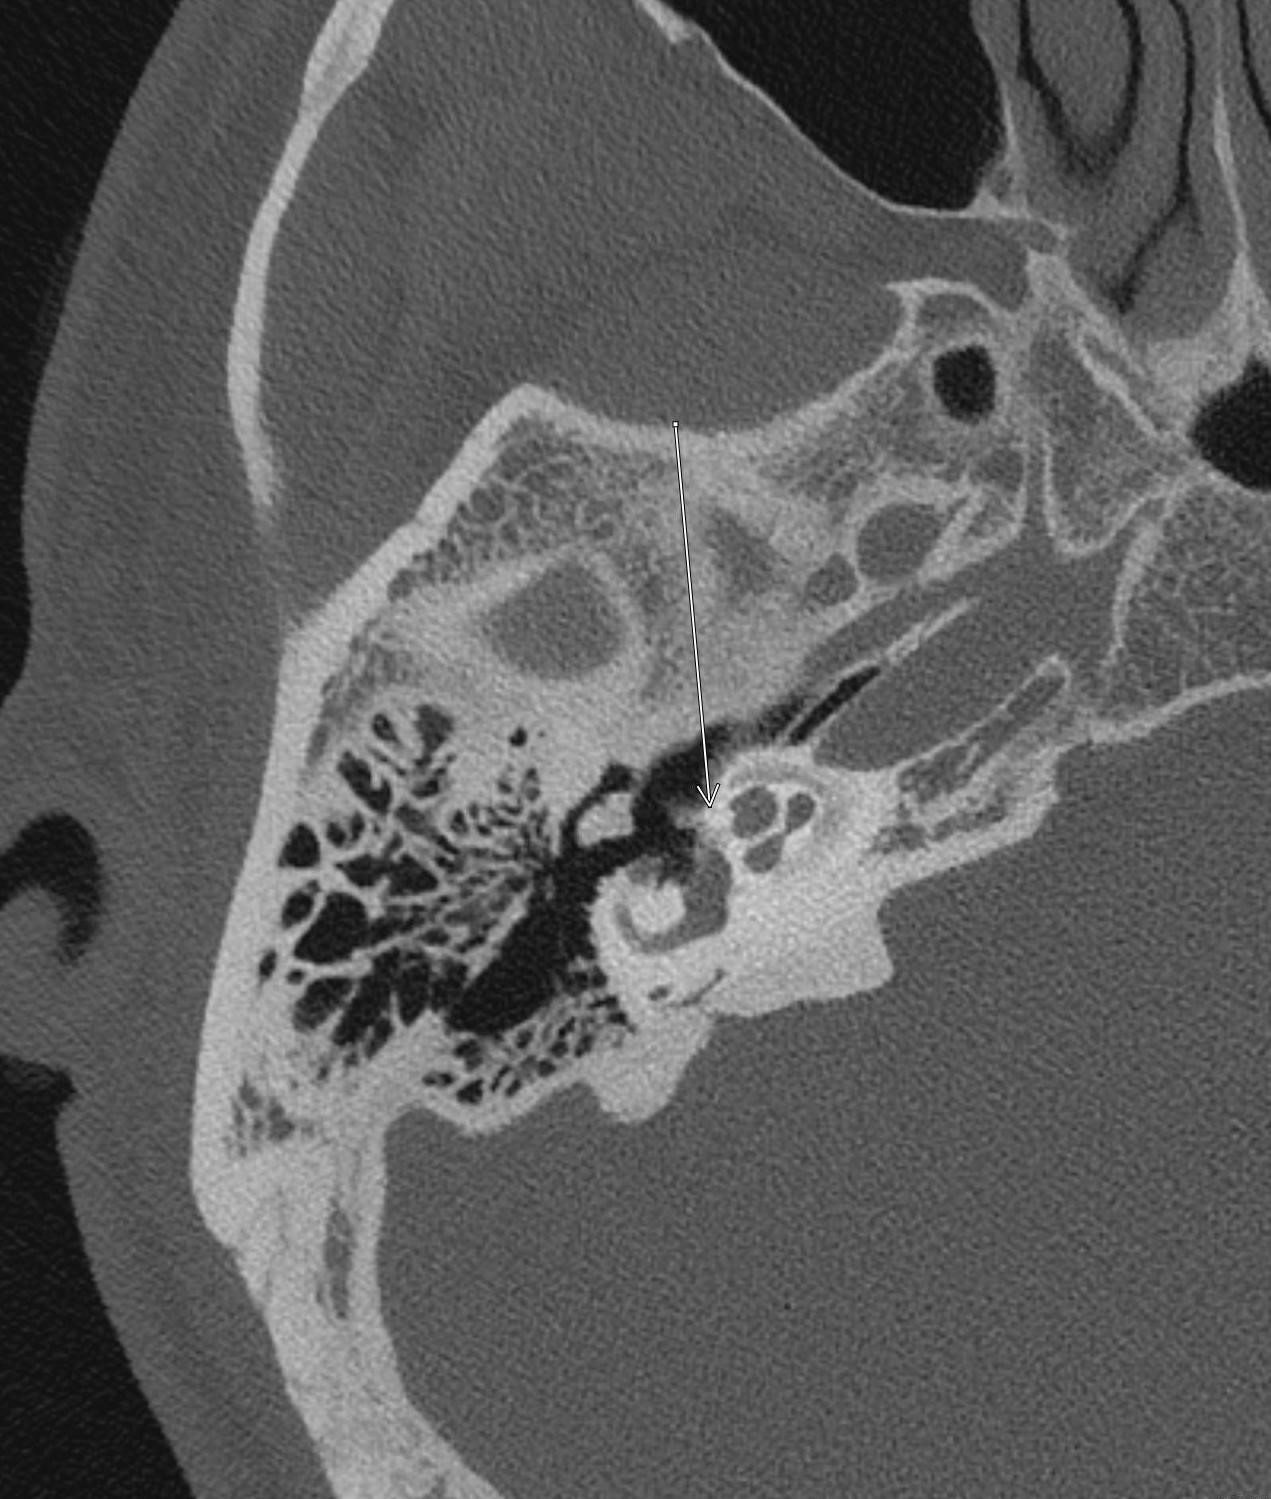
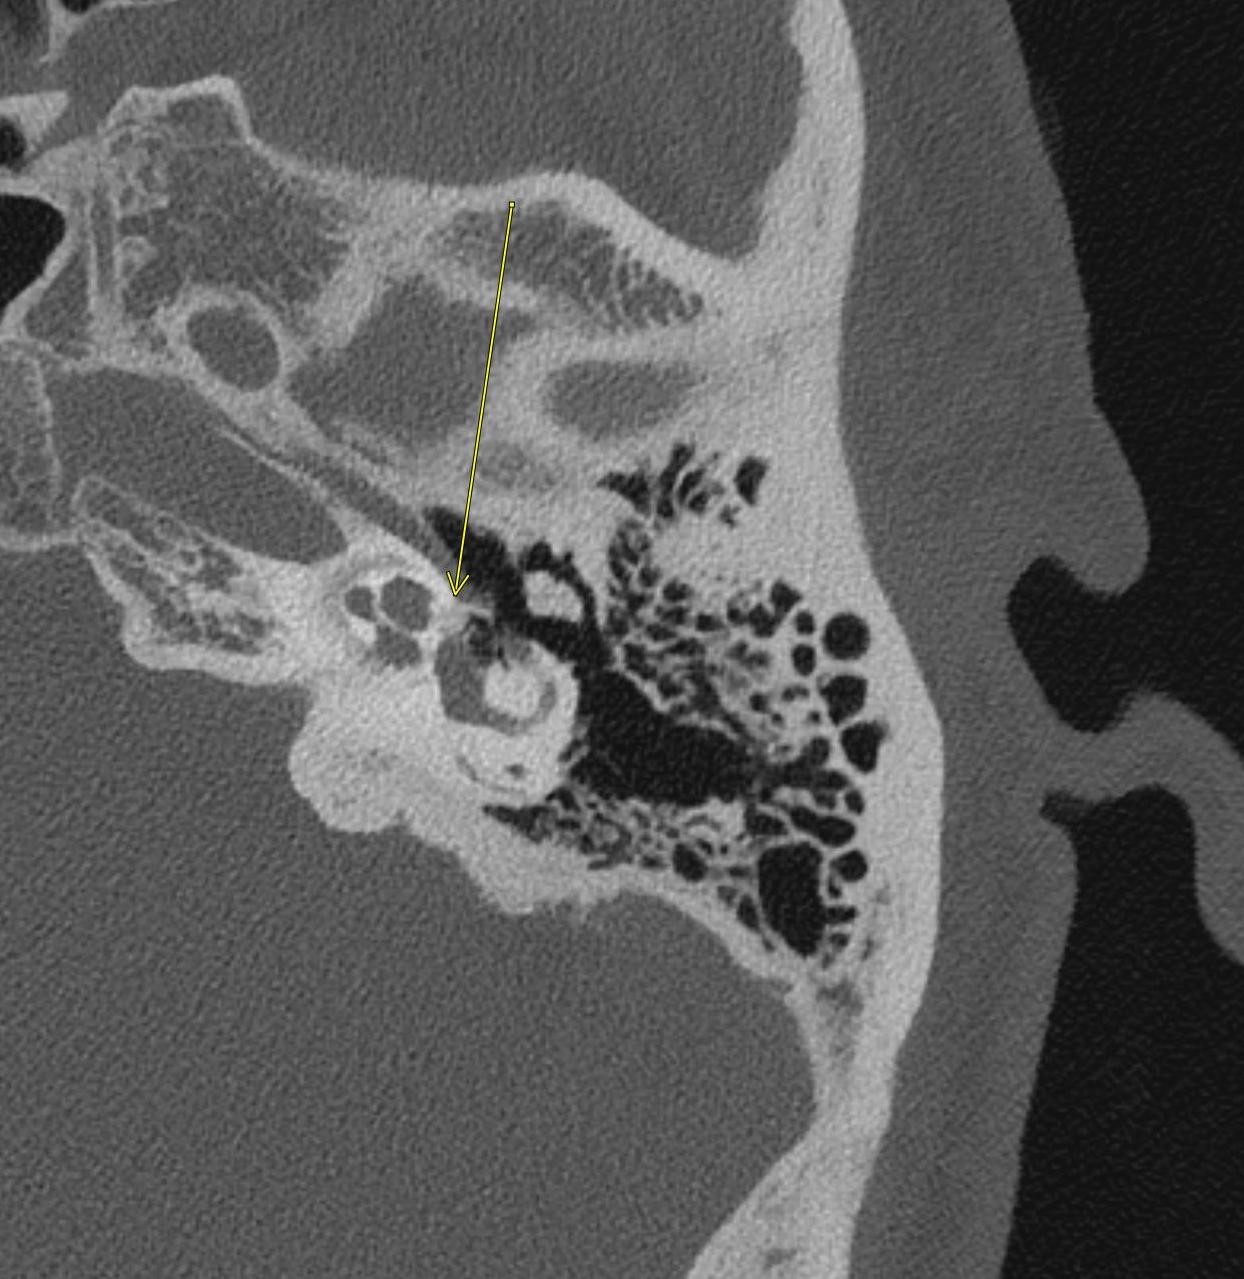
Bilateral axial CT temporal bone images show demineralization/lucency of the fissula ante fenestrae on both the right and the left. This finding is classic for fenestral otosclerosis.
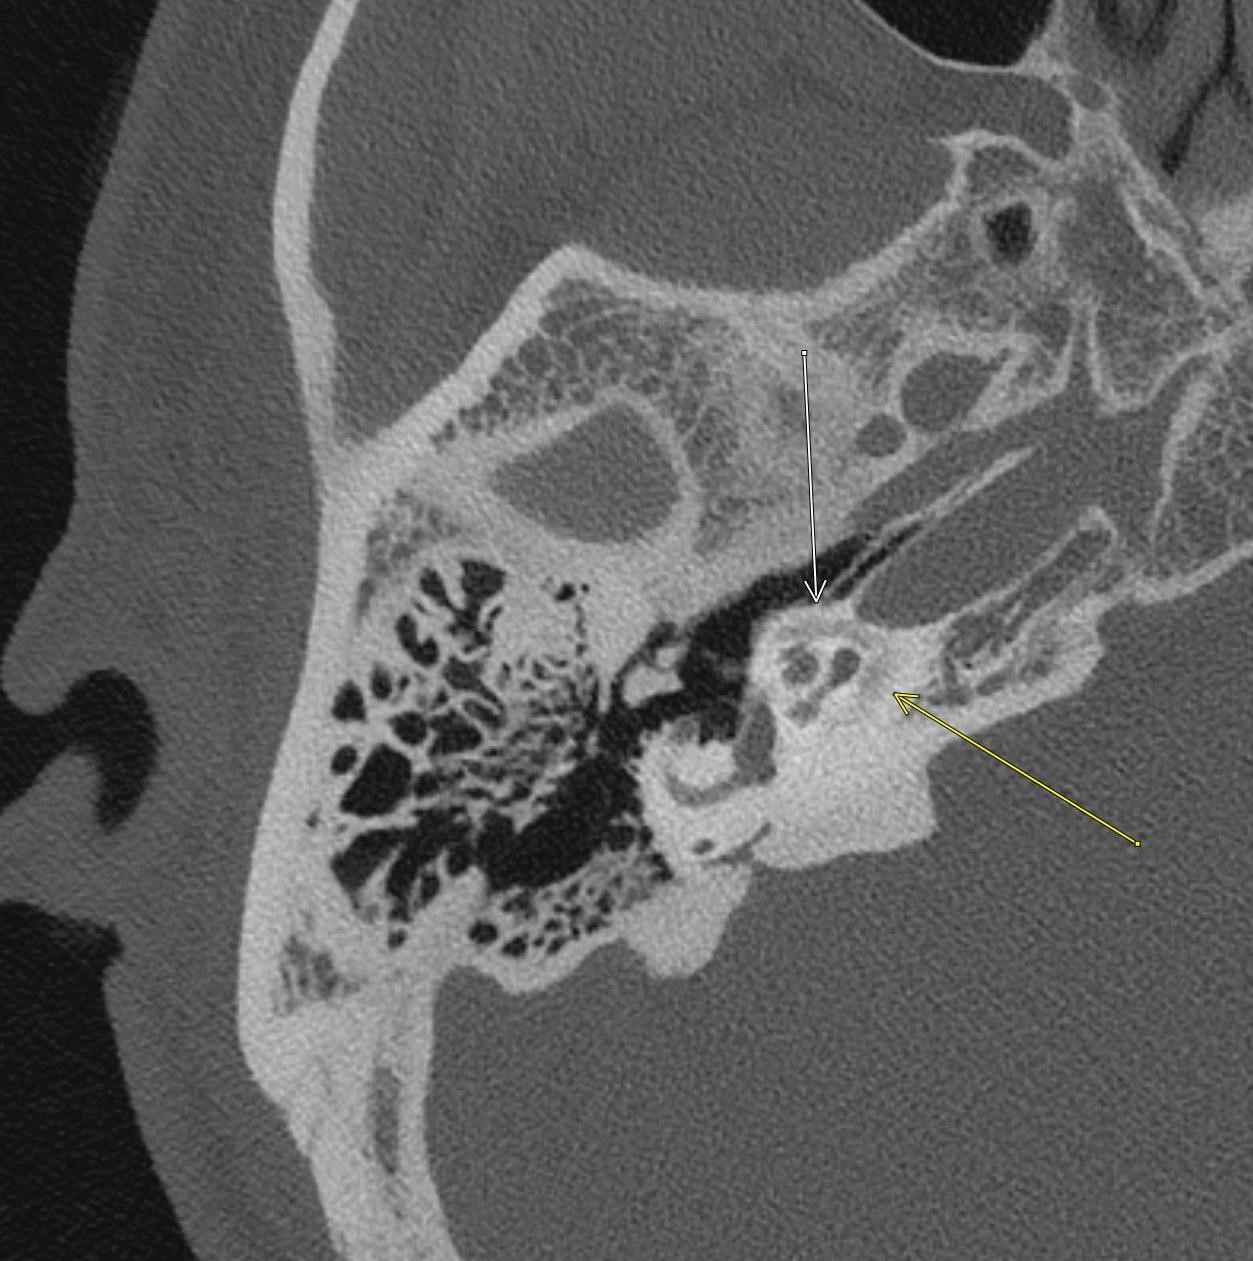
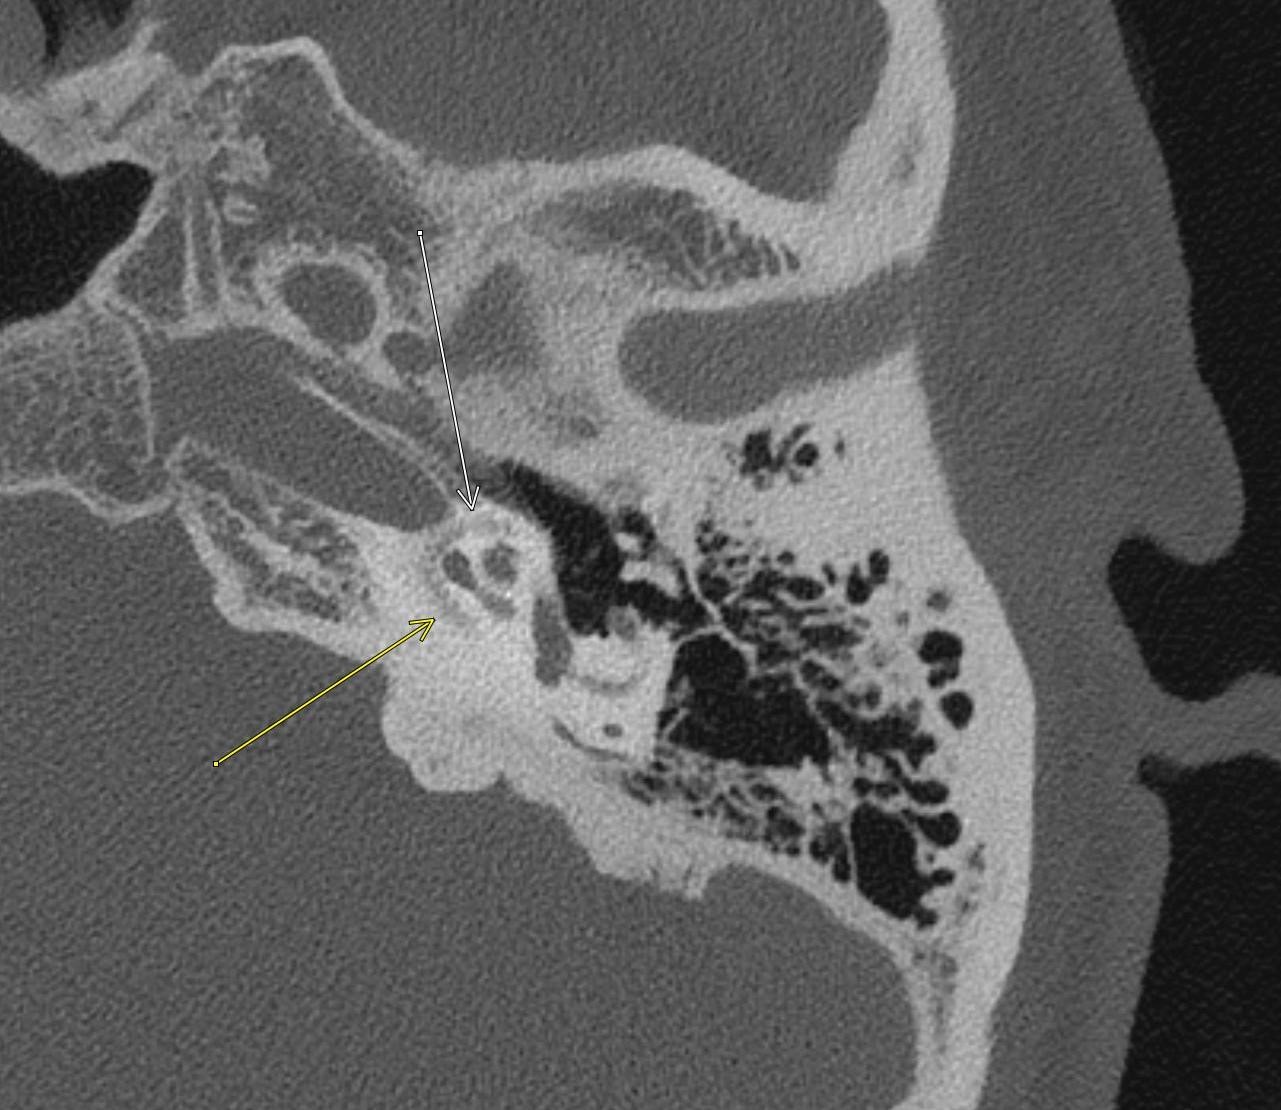
Bilateral axial CT temporal bone images show demineralization/lucency of the bone surrounding the cochlea, which is nearly circumferential in involvement. This finding is classic for retrofenestral otosclerosis.
Diagnosis: Bilateral fenestral and retrofenestral otosclerosis
Teaching Points:
Otosclerosis is one of the most common causes of hearing loss in adults. It is primary osteodystrophy of the otic capsule and is often known as otospongiosis rather than otosclerosis because the main imaging feature is bony lucency. There are actually two phases of the disease, with the early/active phase being the lucent phase where osteocytes absorb the bone in the otic capsule, and the late/inactive phase being the sclerotic phase where osteoblasts form irregular foci of new bone.
Otosclerosis is most common in females and usually presents in the 40s-50s with gradual, slowly progressive hearing loss. The hearing loss is usually conductive but can be sensorineural or mixed. It is often bilateral.
There are two types of otosclerosis: fenestral and retrofenestral. Fenestral is the most common type (80% of cases) and involves the fissula ante fenestram, just anterior to the oval window near the stapes footplate. Retrofenestral otosclerosis is less common and is usually seen with fenestral otosclerosis, when present. The two are a continuum rather than distinct entities. In retrofenestral otosclerosis, the round window niche or bone surrounding the cochlea is involved. Most cases are imaged in the early/active otospongiotic phase and the dominant imaging finding is demineralization/lucent bone. The normal bone within the otic capsule should be very dense, and otosclerosis will appear lucent when compared to the remainder of the bone, as seen in the above case. In the late/inactive otosclerotic phase, the affected bone actually increases in density and the otic capsule can appear abnormally thickened.
Treatment usually involves a stapedectomy with stapes prosthesis in fenestral otosclerosis, since the stapes can become fixated due to bony overgrowth.
References:
- Lee TC, Aviv RI, et al. CT Grading of Otosclerosis. American Journal of Neuroradiology. 2009; 30(7): 1435-1439.
- Juliano AF, Ginat DT, et al. Imaging Review of the Temporal Bone: Part II: Traumatic, Postoperative, and Noninflammatory Nonneoplastic Conditions. Radiology. 2015; 276(3): 655-672.
- Niyazov D, et al. Fenestration surgery for otosclerosis. American Journal of Neuroradiology. 2000; 21(9): 1670-1672.
February 21, 2022:Malignant Course of the Right Coronary Artery
History: A 30-year-old male presents to the Emergency Department after cardiac arrest.
Findings:
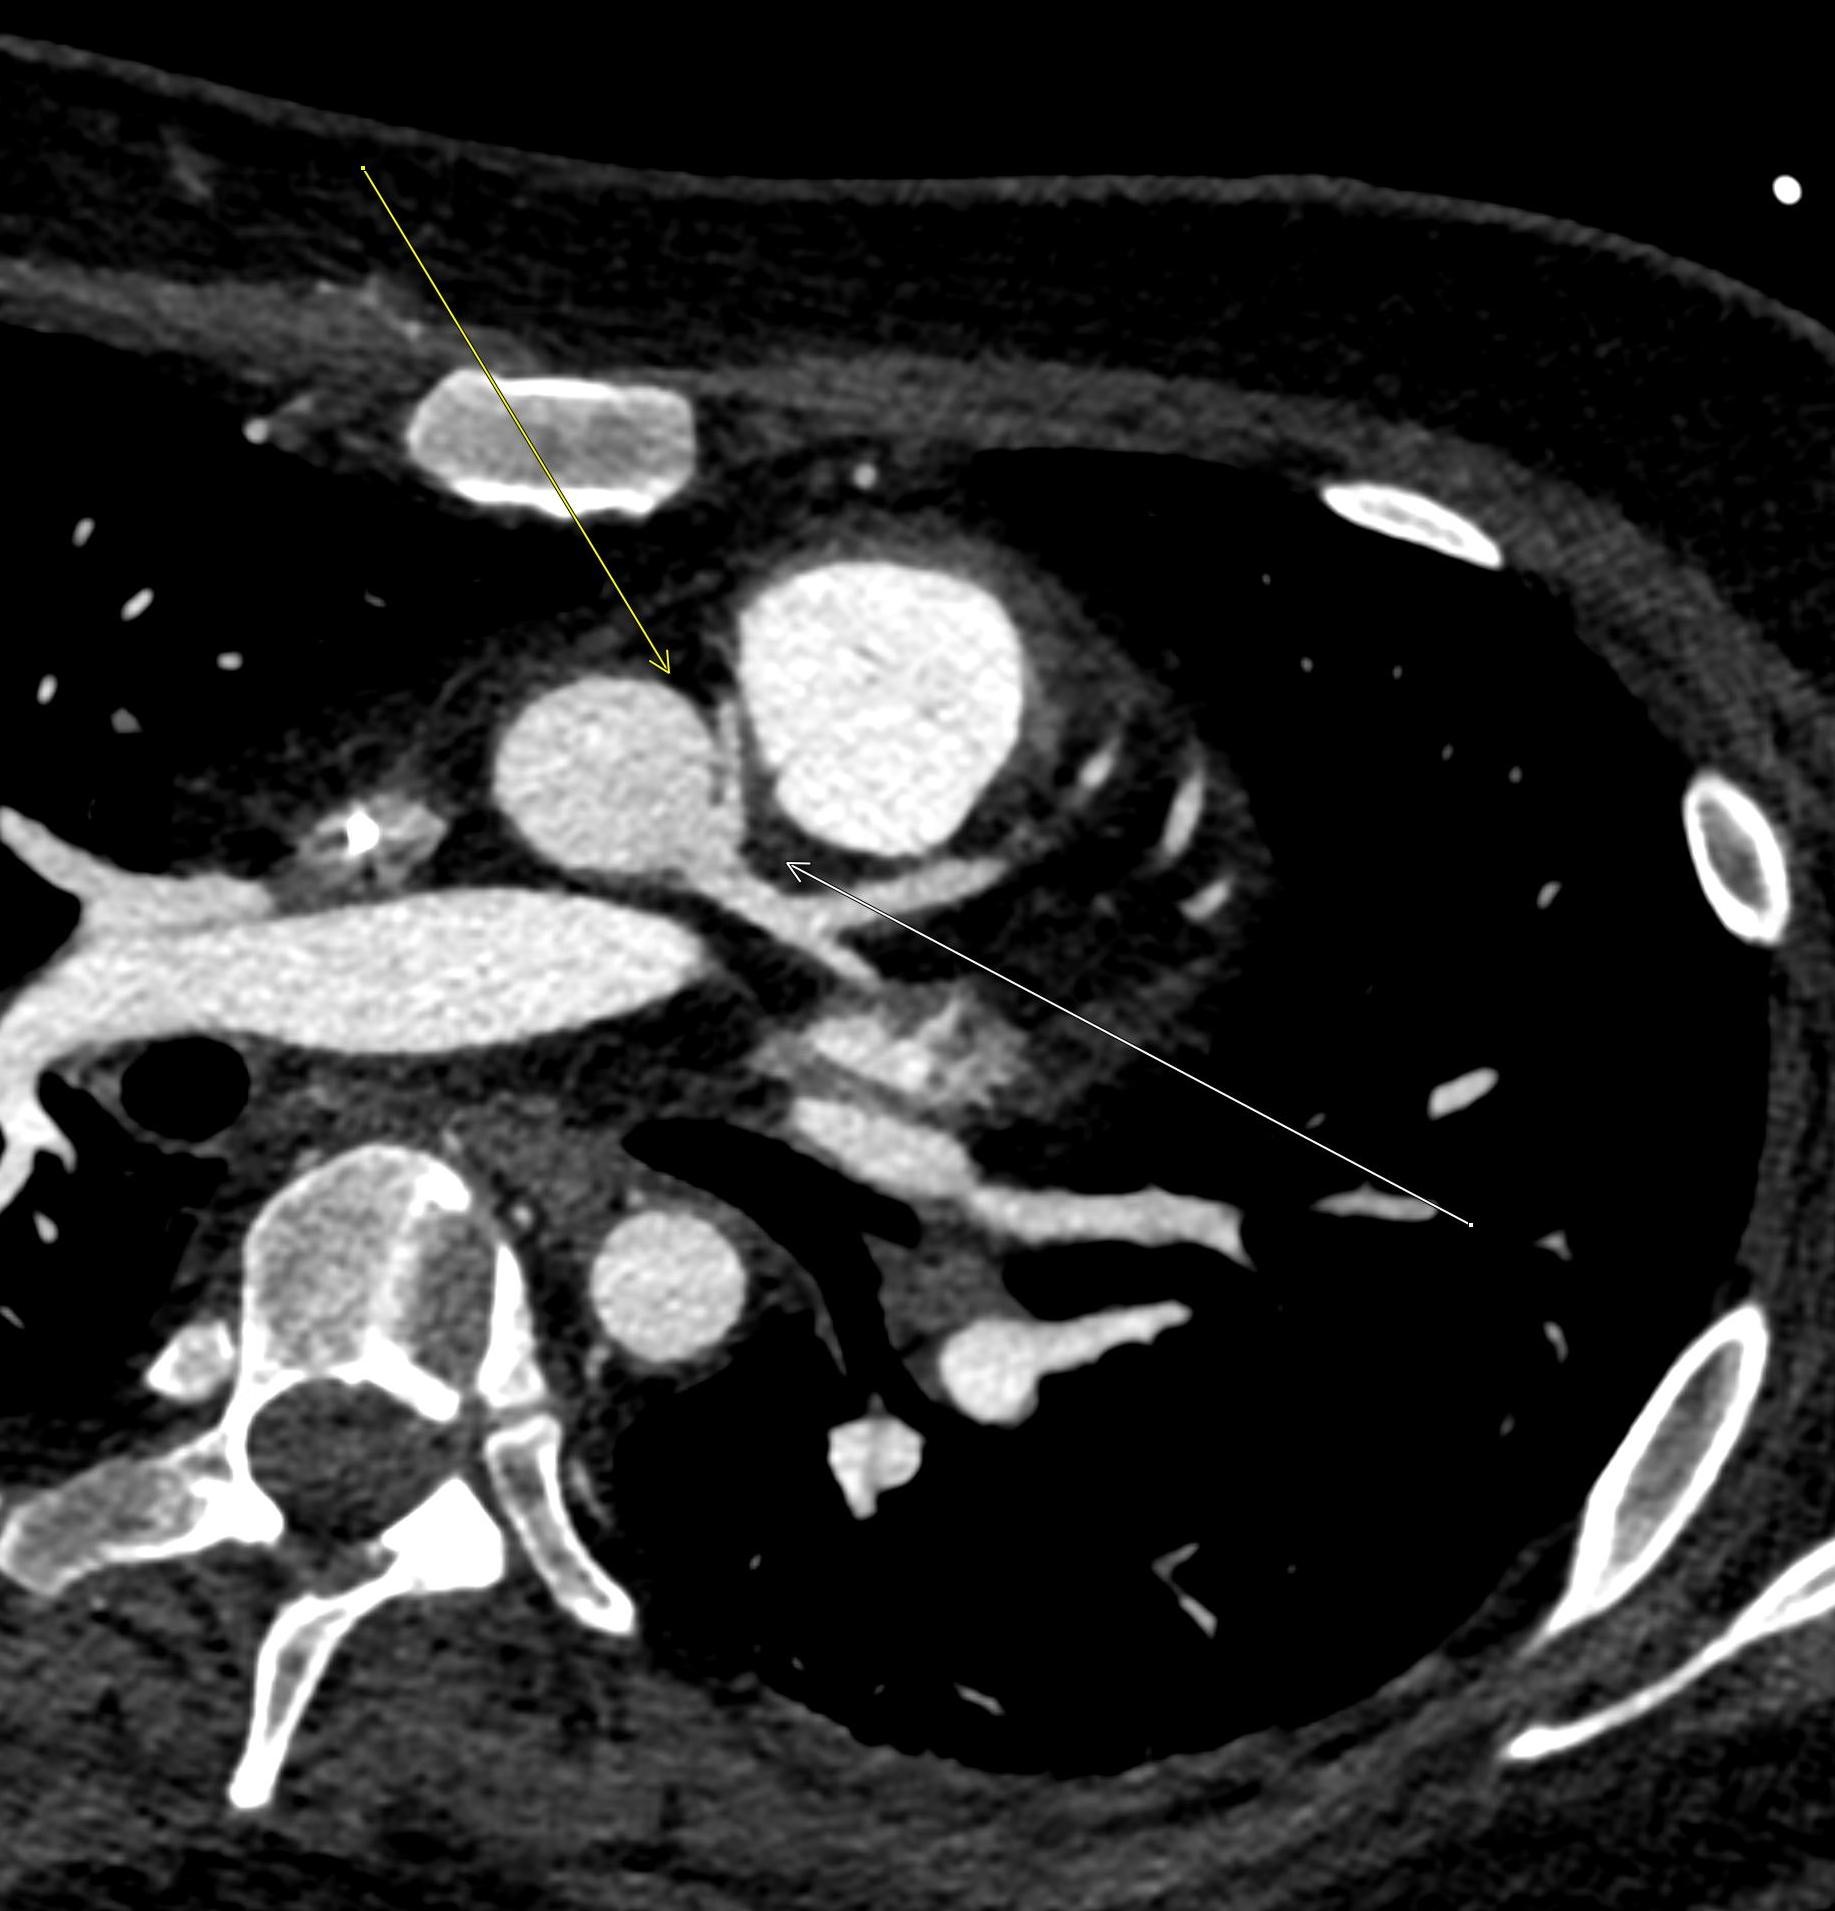
Axial image from CT coronary angiogram demonstrates a malignant course of the right coronary artery, which has an aberrant origin from the left coronary cusp. From the left coronary cusp, it passes at an acute angle to the right between the pulmonary trunk and ascending aorta. The origin is slit-like and the proximal RCA is narrowed between the ascending aorta and pulmonary trunk.
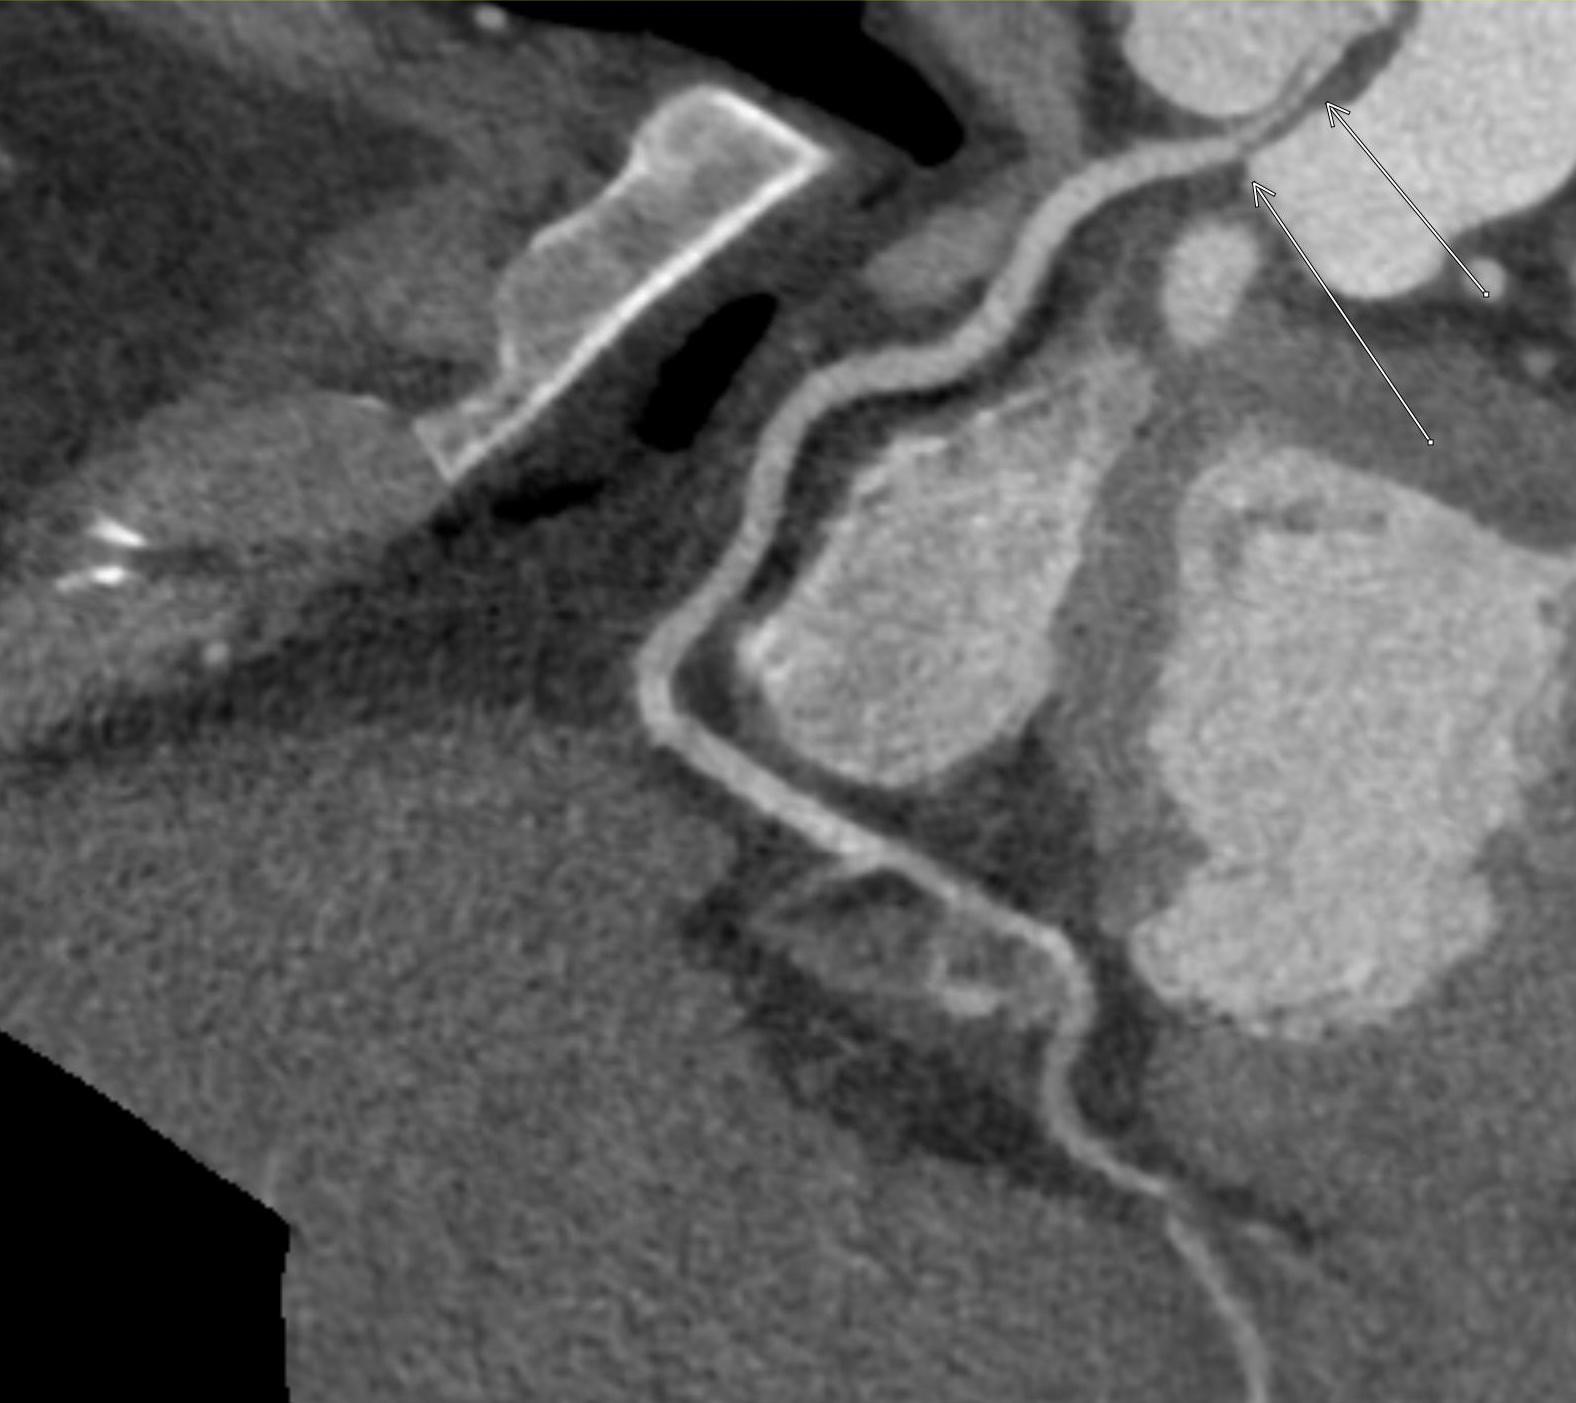
A curved multiplanar reformatted view of the right coronary artery again demonstrates the slit-like origin of the RCA from the left coronary cusp and significant narrowing of the vessel between the pulmonary trunk and ascending aorta.
Note that the remainder of the RCA distal to its interarterial course is widely patent and otherwise normal in appearance.
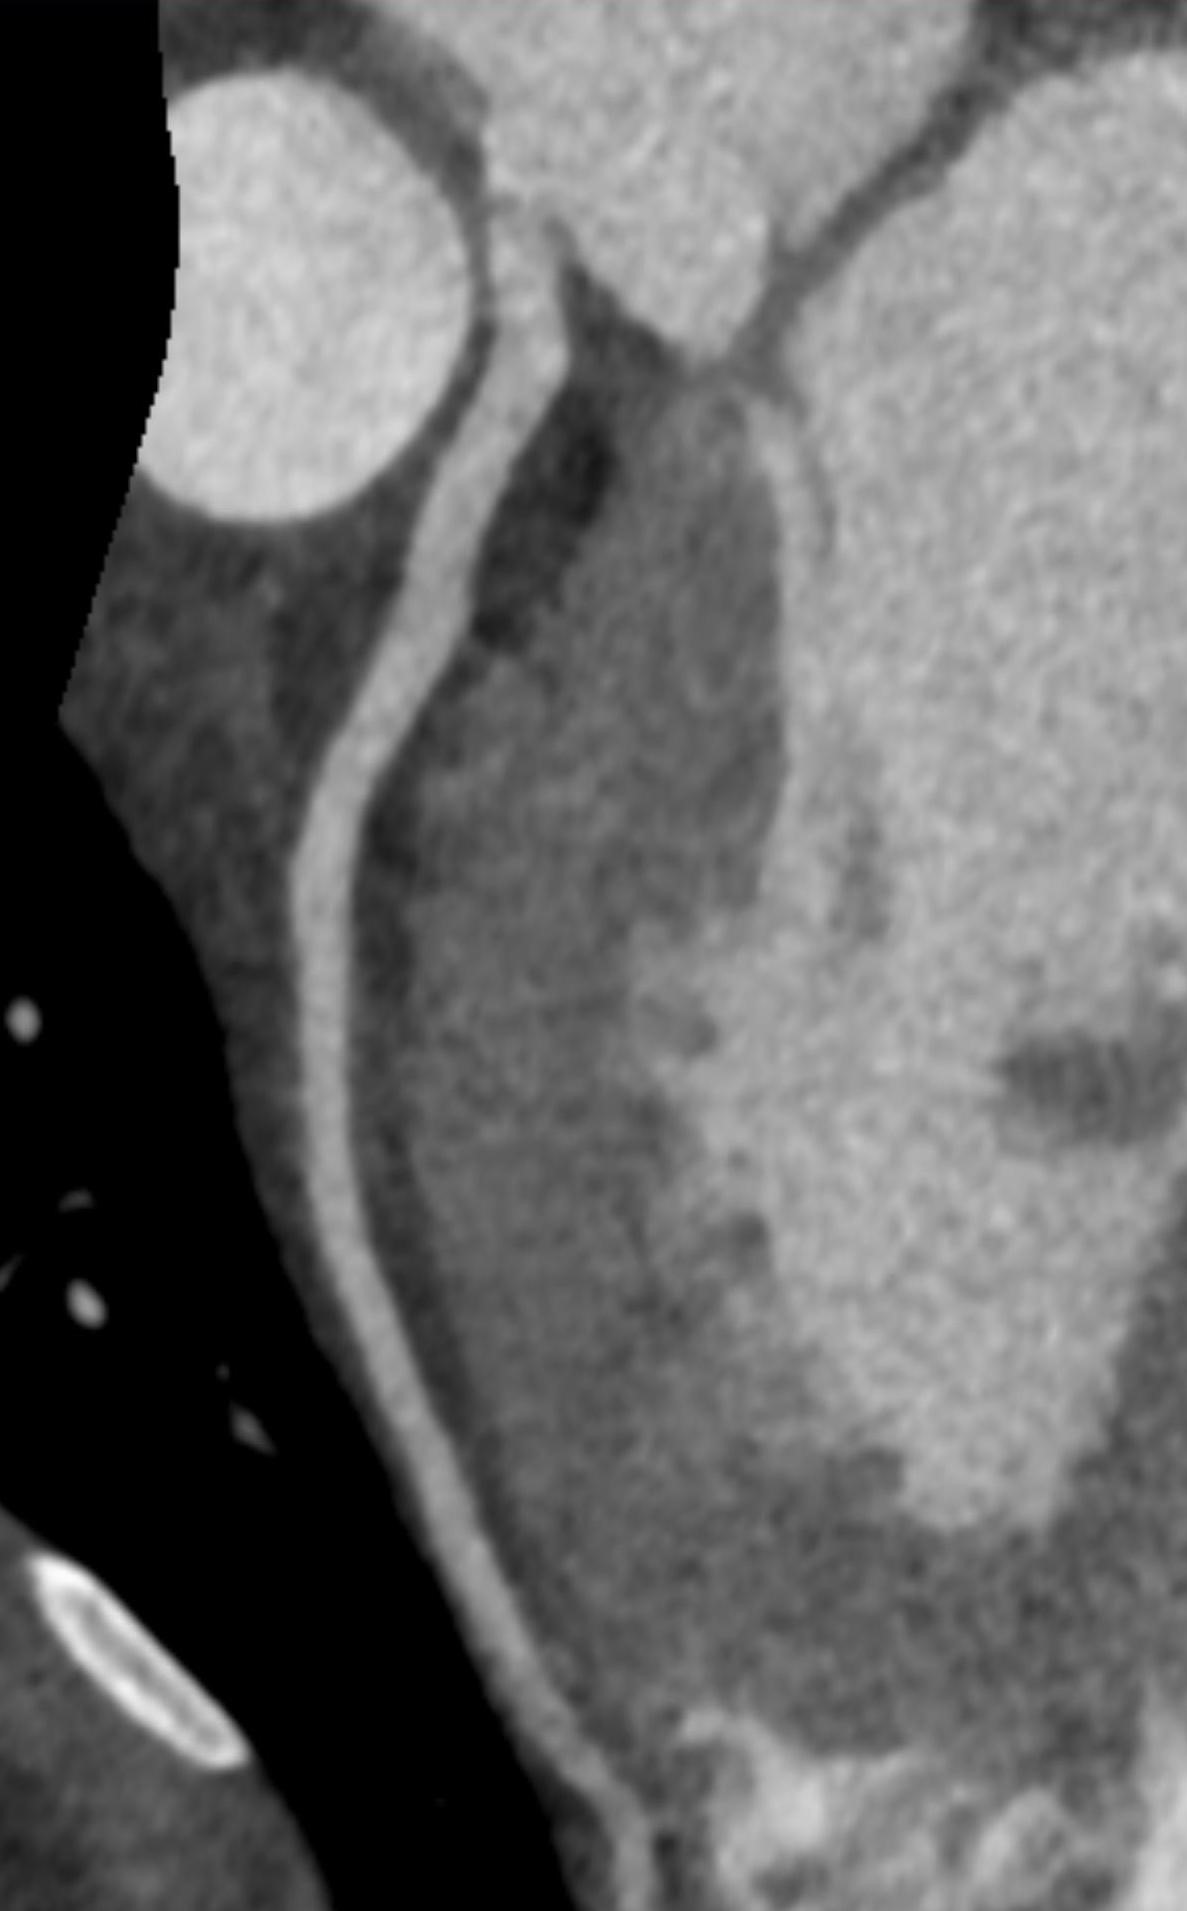
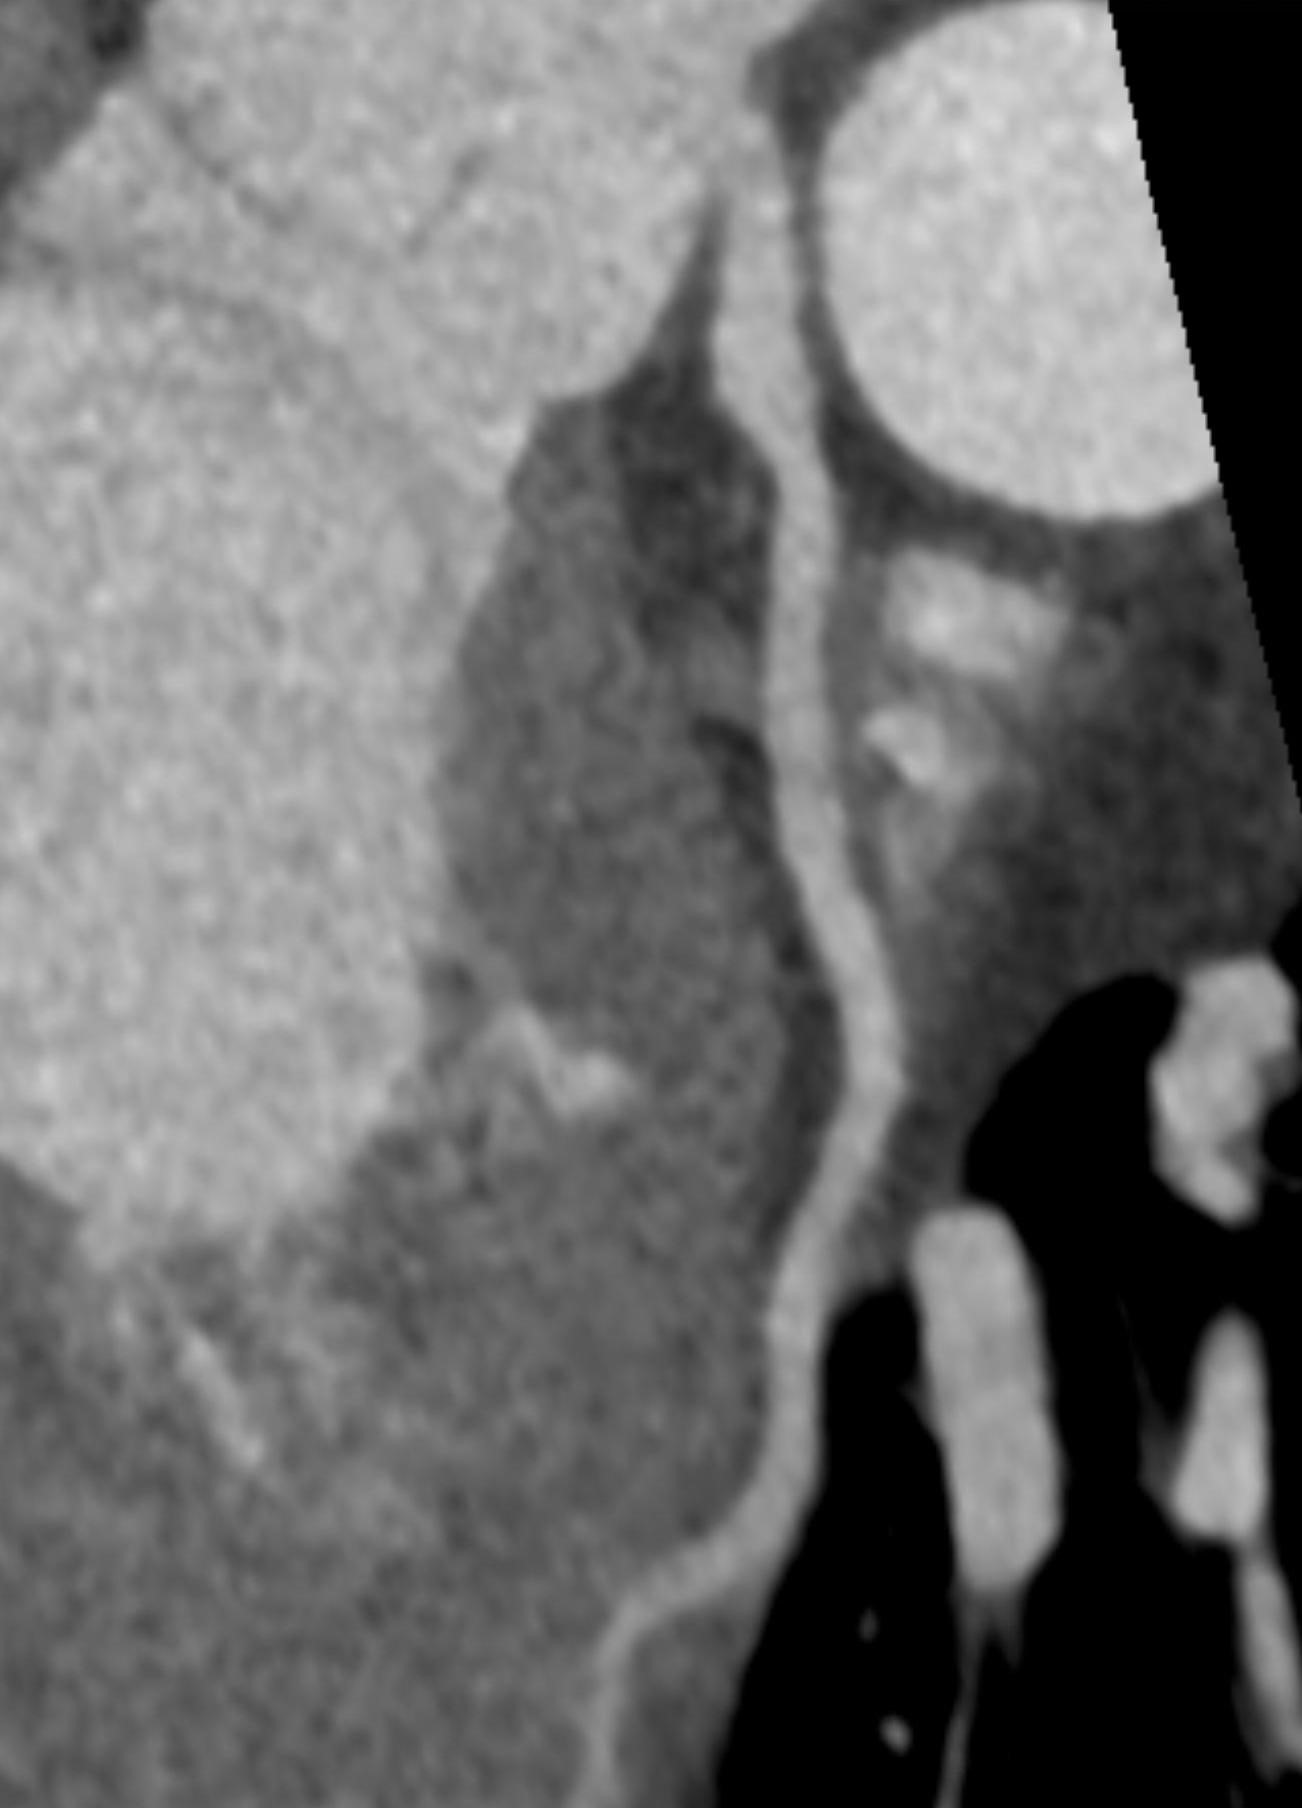
Curved multiplanar reformatted views of the left anterior descending artery and left circumflex artery show widely patent vessels without significant stenosis.
Diagnosis: Malignant Interarterial Course of the Right Coronary Artery
Teaching Points:
When the right coronary artery arises from the left coronary cusp and passes between the pulmonary trunk and ascending aorta, it is termed a “malignant course” because of a potential risk of cardiac ischemia. When arising from the left cusp, the RCA can take an interarterial/intramural course where a portion of the coronary artery actually travels within the wall of the ascending aorta, an interarterial/extramural course (shown above) in which the coronary artery travels in the space between the pulmonary trunk and ascending aorta, or an interatrial course. The interatrial/intramural course is associated with the highest risk of sudden cardiac death. The presence of an intramural segment can be inferred by an elliptical cross-section of the artery.
Anomalous coronary arteries are actually the second most common cause of sudden cardiac death after hypertrophic cardiomyopathy. The exact etiology of cardiac ischemia/myocardial infarction in the setting of a malignant course of the RCA is debated, with some believing it is due to extrinsic compression of the coronary artery and others postulating that the acute angle and slit-like origin of the RCA as it makes its sharp turn to the right actually causes the ischemia.
Imaging is best with coronary CT angiography, but can also be performed with MR angiography or echocardiography.
Surgical treatment is often (but not always) required for scenarios that involve an anomalous left main coronary artery coursing between the great arteries, documented coronary ischemia due to compression between the great arteries, an intramural course, or an anomalous origin of the right coronary artery between the great arteries with evidence of ischemia. Surgical options include coronary artery reimplantation, CABG, or unroofing.
References:
- Agarwal P, Dennie C, et al. Anomalous Coronary Arteries That Need Intervention: Review of Pre- and Postoperative Imaging Appearances. Radiographics. 2017; 37(3): 740-756.
- Satija B, Sanyal K, et al. Malignant anomalous right coronary artery detected by multidetector-row computed tomography coronary angiography. J Cardiovasc Dis Res. 2012; 3(1): 40-42.
- Lim J, Beale A, et al. Anomalous origination of a coronary artery from the opposite sinus. Nat Rev Cardiol. 2011; 8(12): 706-719.
February 7 , 2022: Ureteritis Cystica
History: 50-year-old male presents with recurrent urinary tract infections.
Findings:
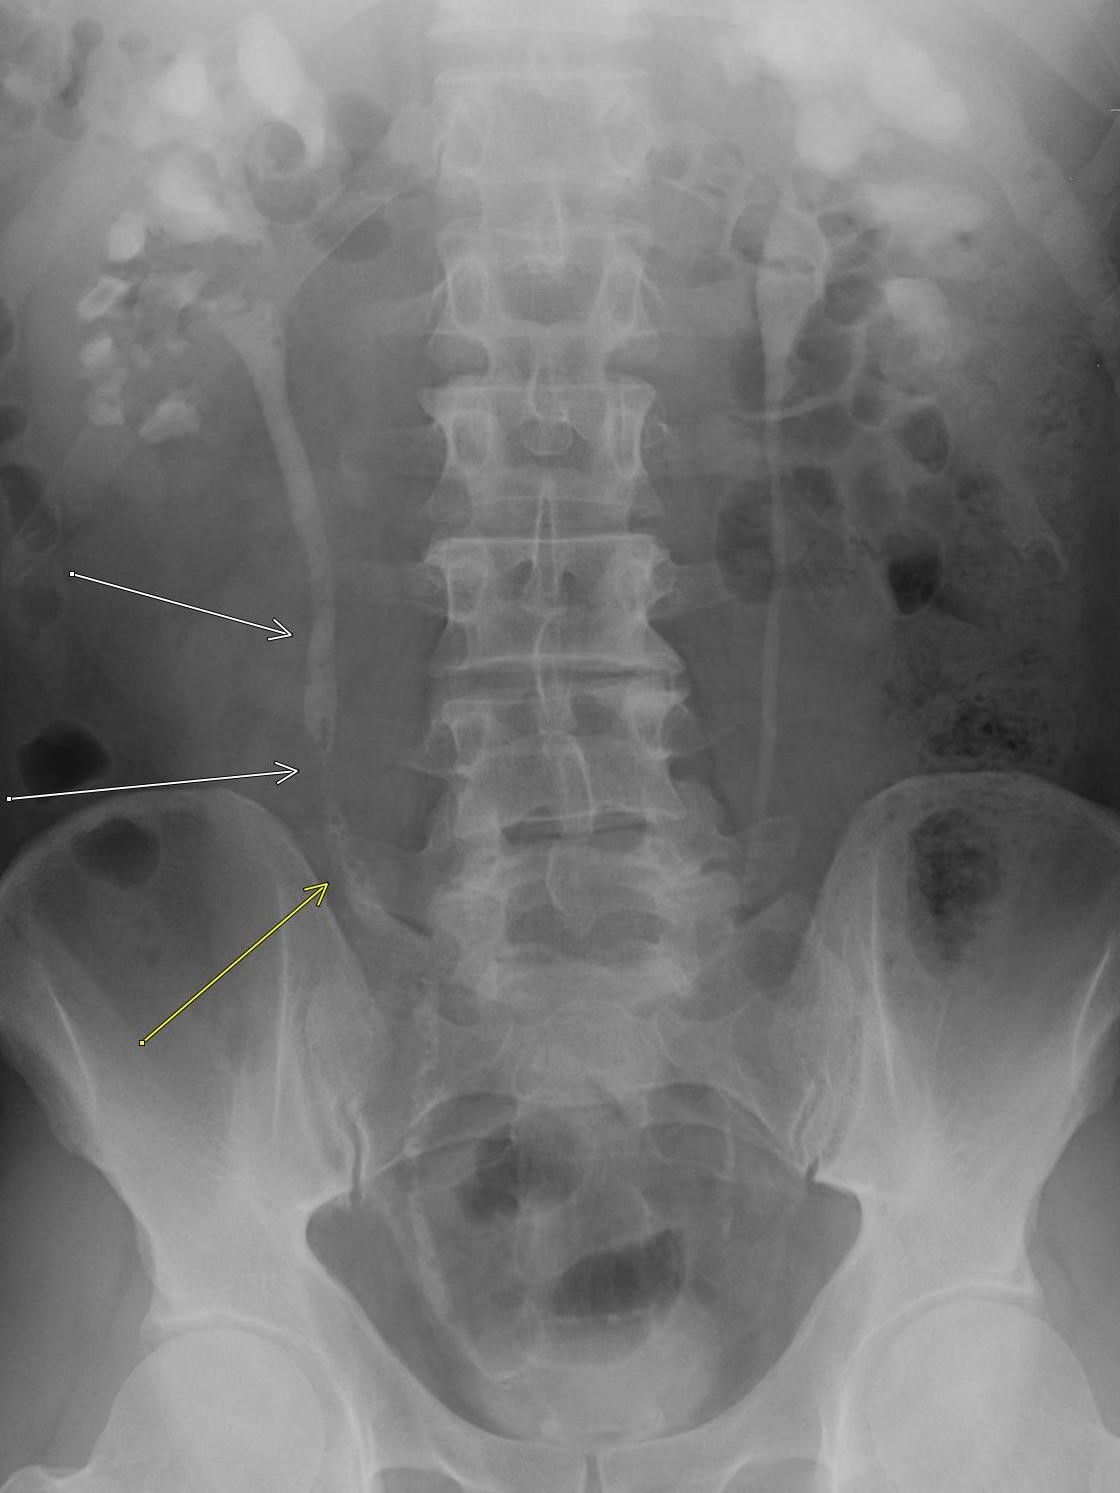
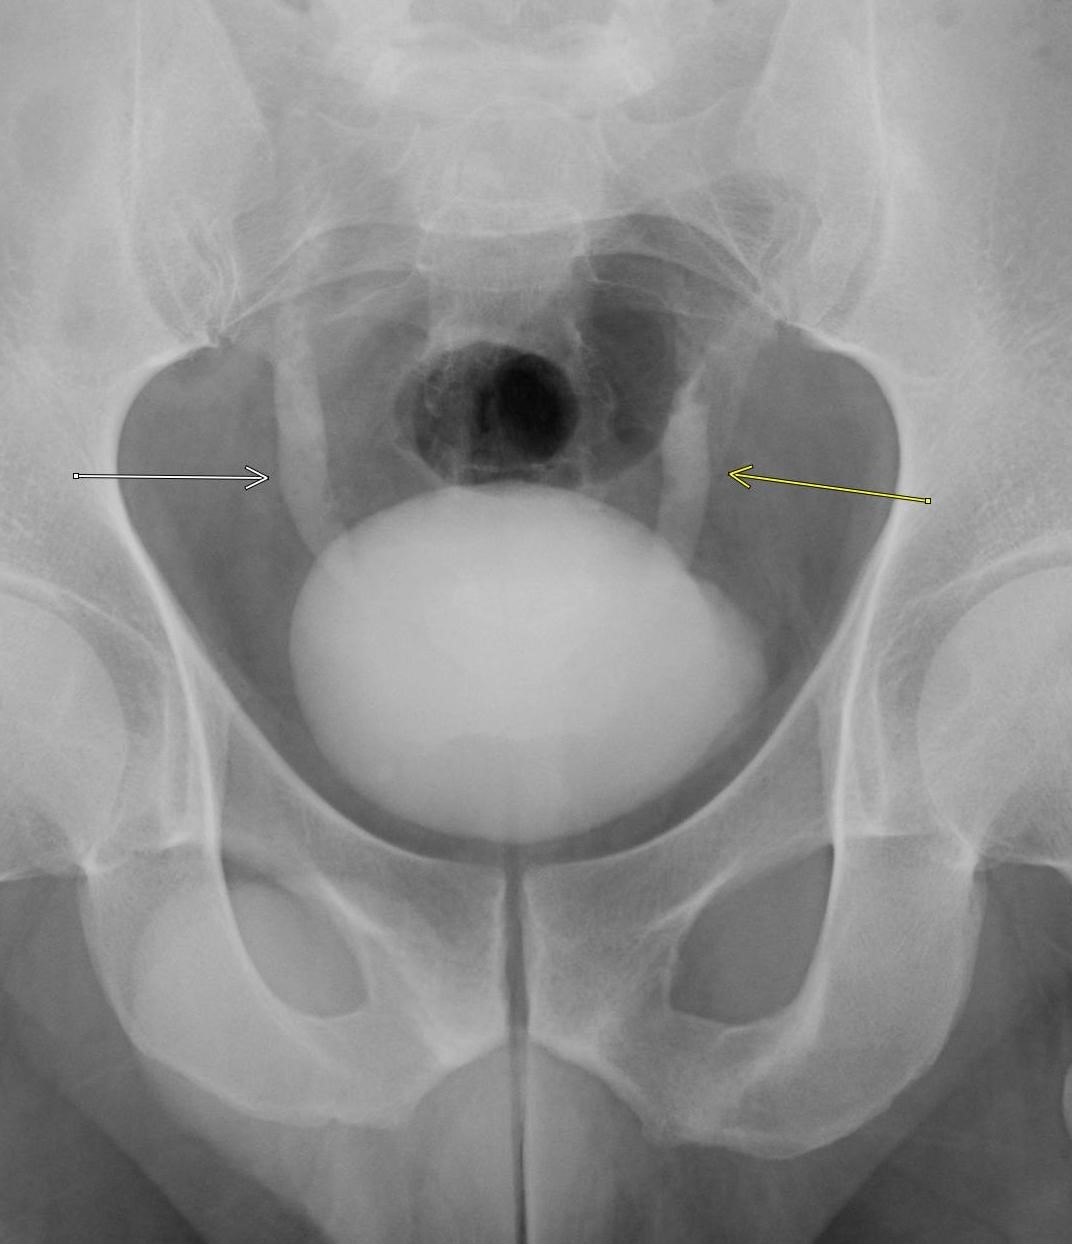
IVP (intravenous pyelography) images show multiple small filling defects throughout the mid and distal left ureter (on the left side of the image due to the posterior acquisition of the study) and a lesser degree of similar appearing filling defects in the distal right ureter.
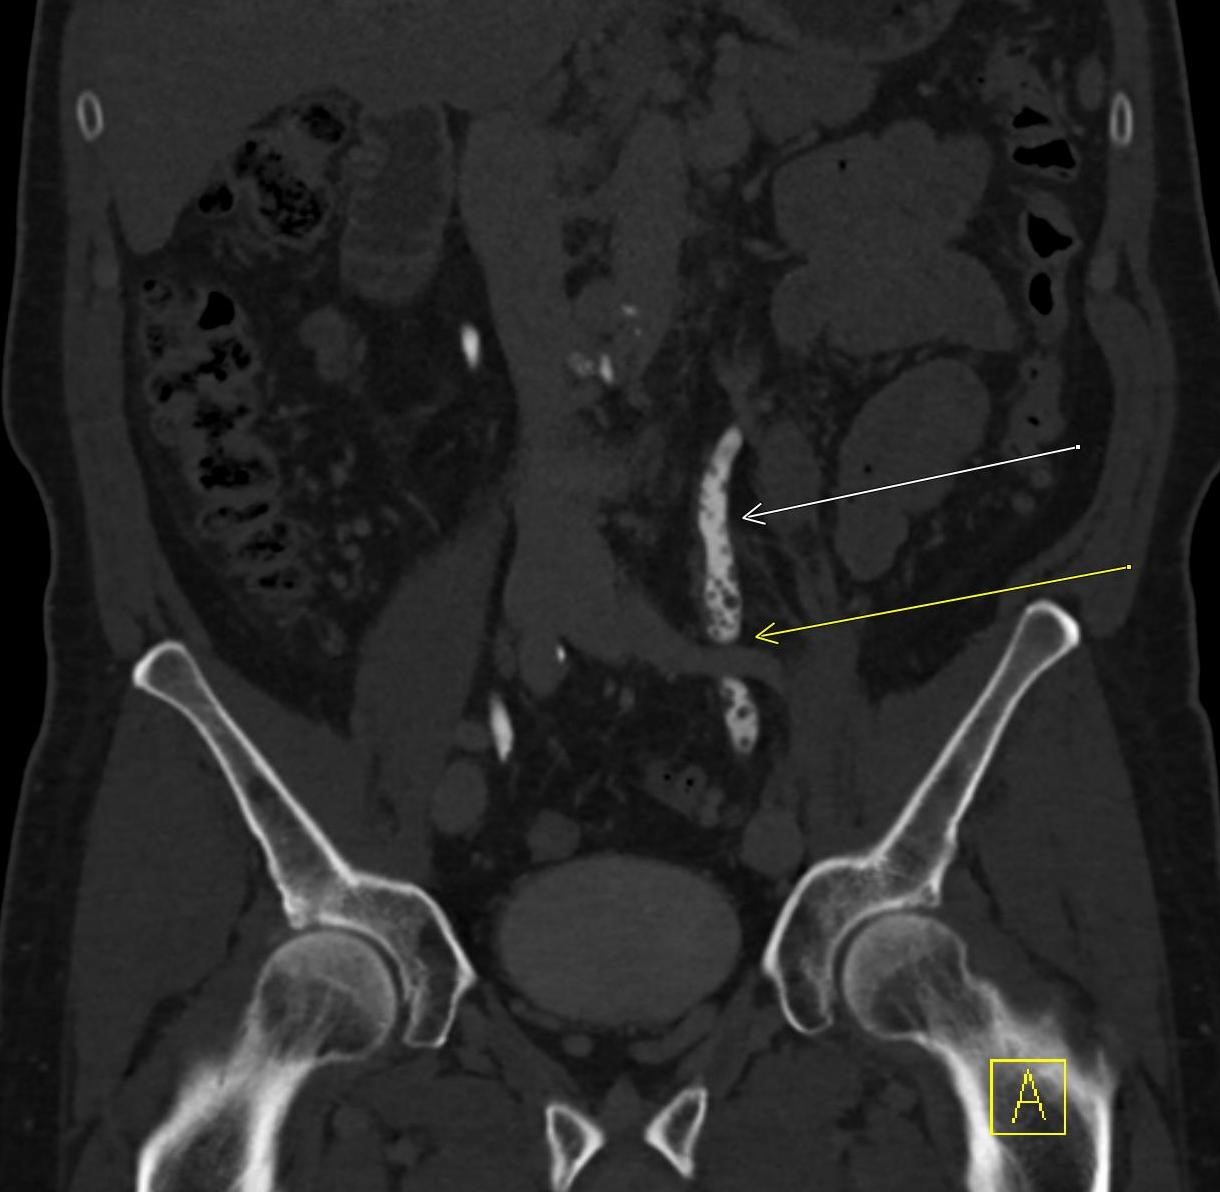
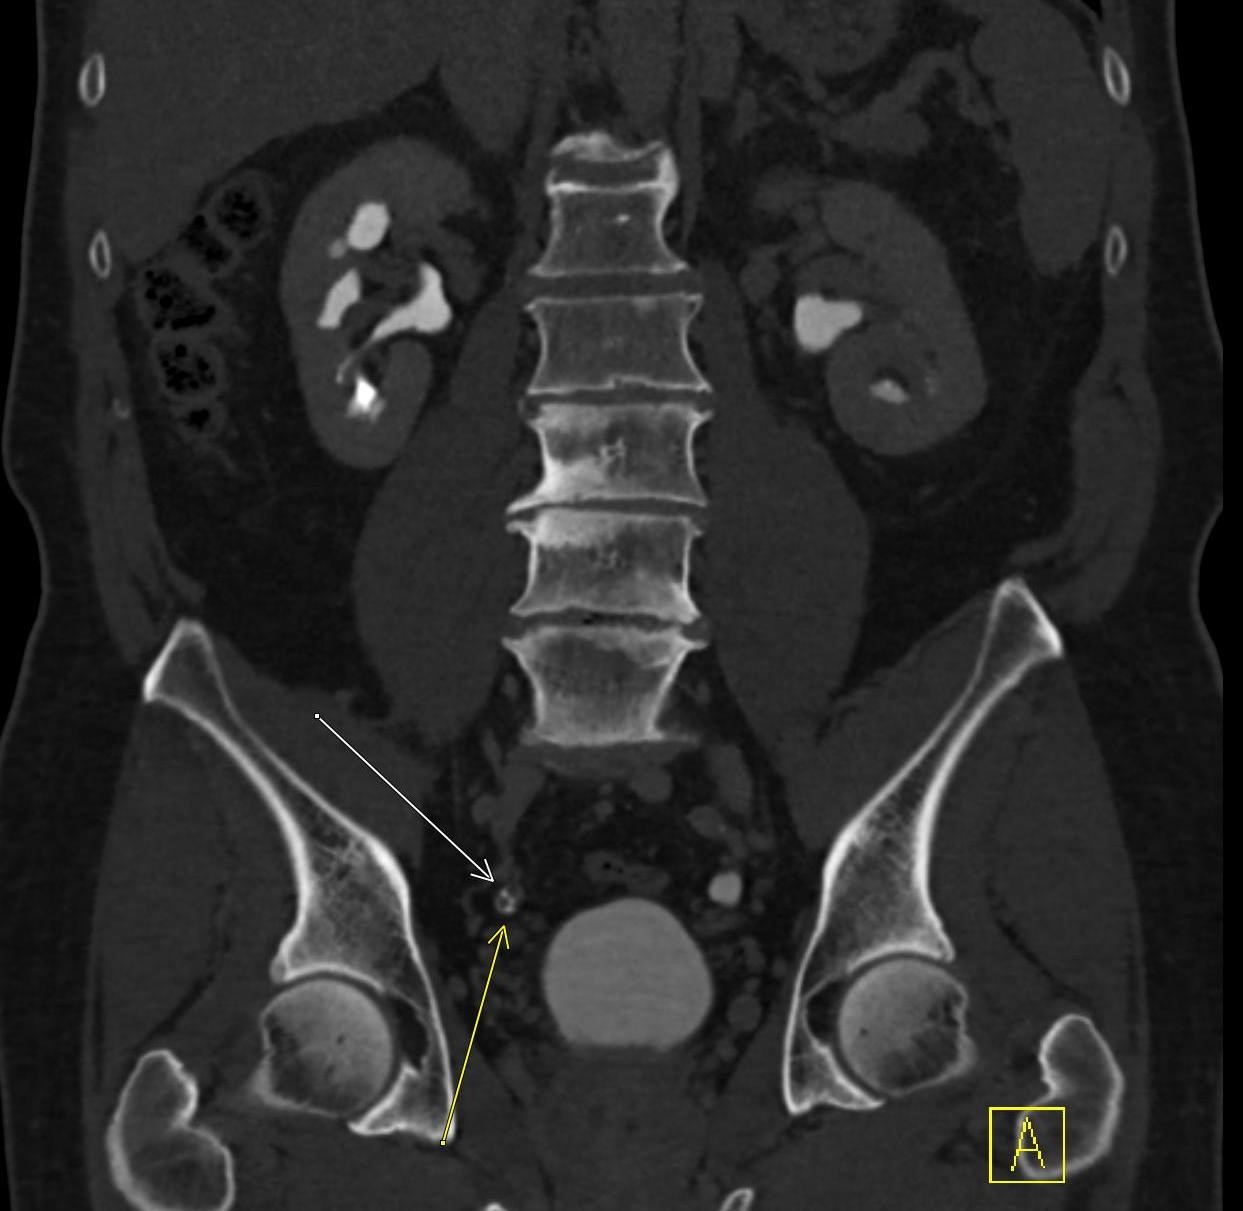
Coronal CT images were obtained for further evaluation. There are numerous small filling defects throughout the mid and distal left ureter and distal right ureter, confirming the findings seen on IVP.
Diagnosis: Ureteritis Cystica
Teaching Points:
Ureteritis cystica is a benign condition of multiple small submucosal cysts lining the ureters. It is usually seen in patients with recurrent urinary tract infections, often diabetics. The infection causes chronic irritation of the ureter and leads to cystic degeneration of the ureteral metaplastic epithelium. In a similar way, patients with recurrent ureteral stones can present with the same findings.
On imaging, the classic finding is numerous small (2-5 mm) smooth, rounded filling defects projecting into the lumen of the ureter. They can occur anywhere along the urinary tract, including the kidney and bladder, although the ureter is the most common site involved. It can be unilateral or bilateral in involvement.
Treatment is aimed at the patient’s recurrent urinary tract infections or ureteral stones, rather than the ureteritis cystica itself given that this is a benign condition. If the underlying cause is treated, the small cysts can sometimes resolve, although many cases remain stable over time.
Differential considerations include ureteral pseudodiverticulosis, in which chronic irritation from recurrent urinary tract infections leads to acquired false diverticula along the course of the ureter. On imaging, this will appear as multiple small outpouchings (rather than the filling defects seen in our cases).
References:
- Loitman B, Chiat H. Ureteritis Cystica and Pyelitis Cystica. Radiology. 1957; 68(3).
- Rothschild J, Wu G. Ureteritis Cystica: A Radiologic Pathologic Correlation. Radiologic-Pathologic Correlation. 2011; 1(23).
- Muraki P, Donin N. Ureteritis cystica mimicking upper tract urothelial cancer in a patient with bladder cancer. Urol Case Rep. 2021; 39.
January 3 , 2022: Transient Osteoporosis of the Hip
History: A 30-year-old female pregnant female presented to the Emergency Department with left hip pain.
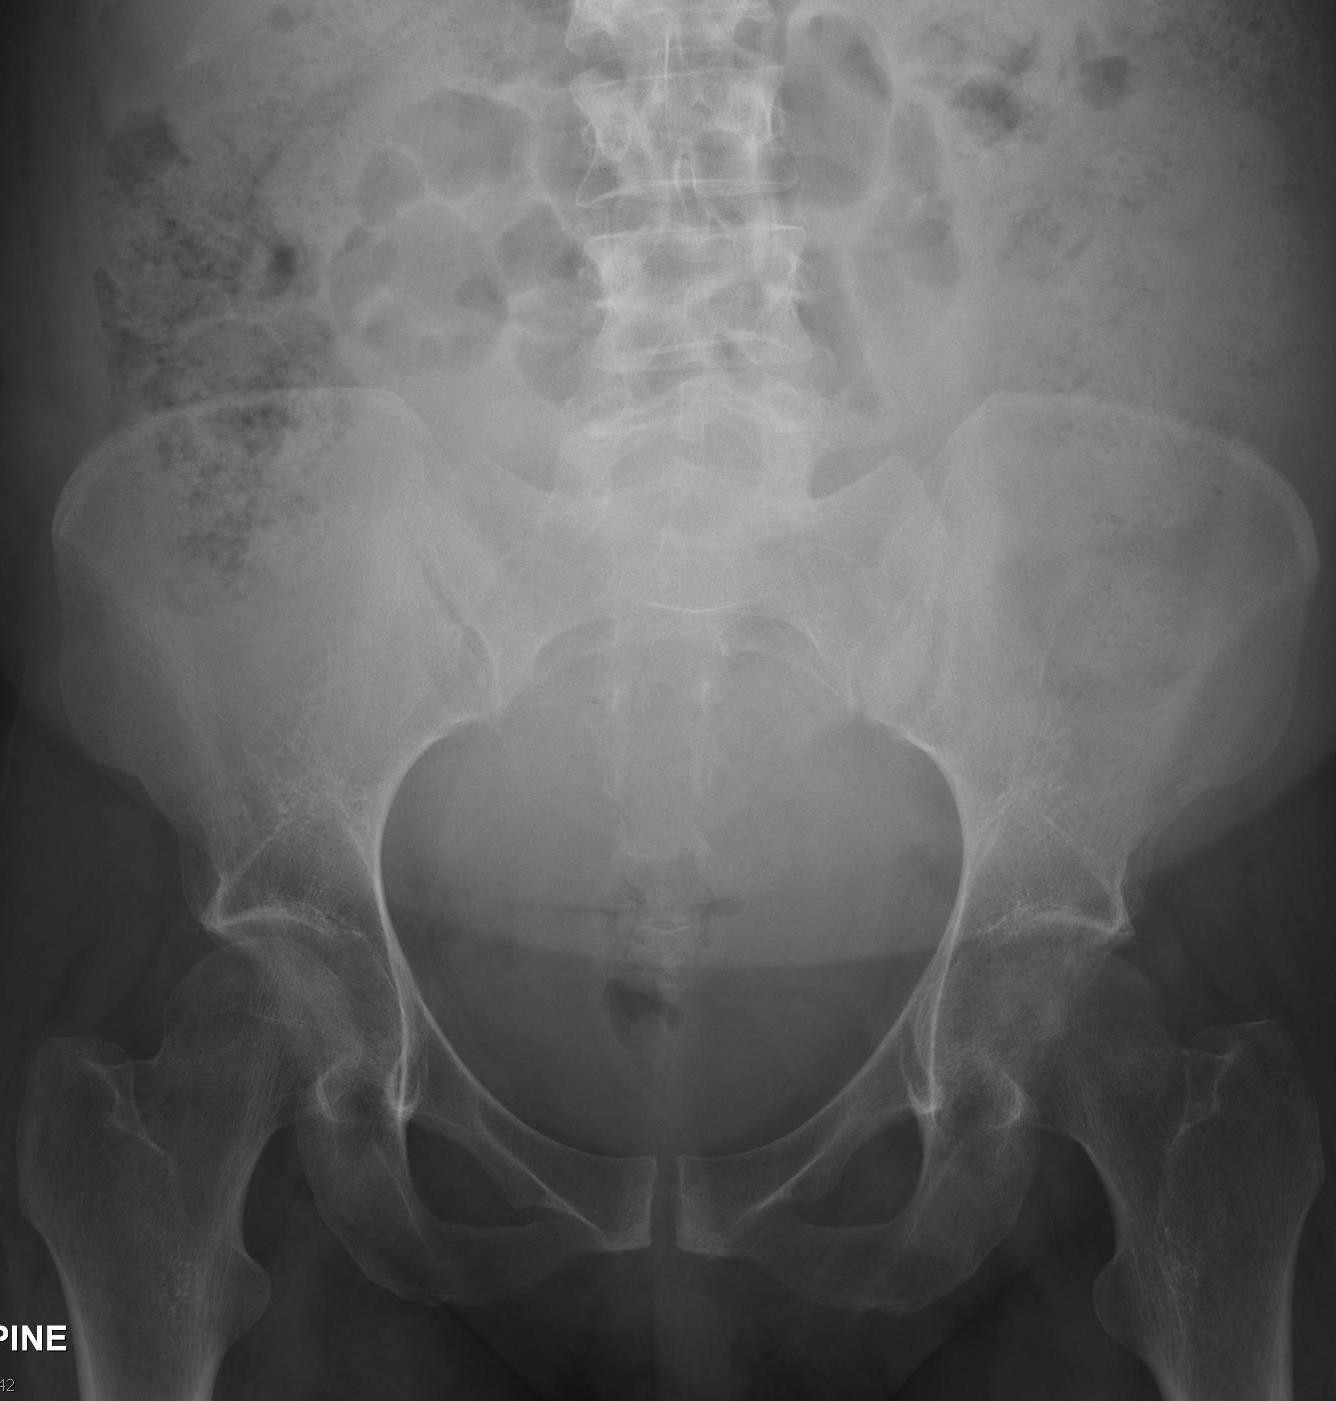
An AP view of the pelvis and hips demonstrates severe lucency/osteopenia of the left femoral head and neck, in contrary to the more normal-appearing right femoral head. There is also subchondral cortical loss of the left femoral head. The remainder of the bones appears normal in density.
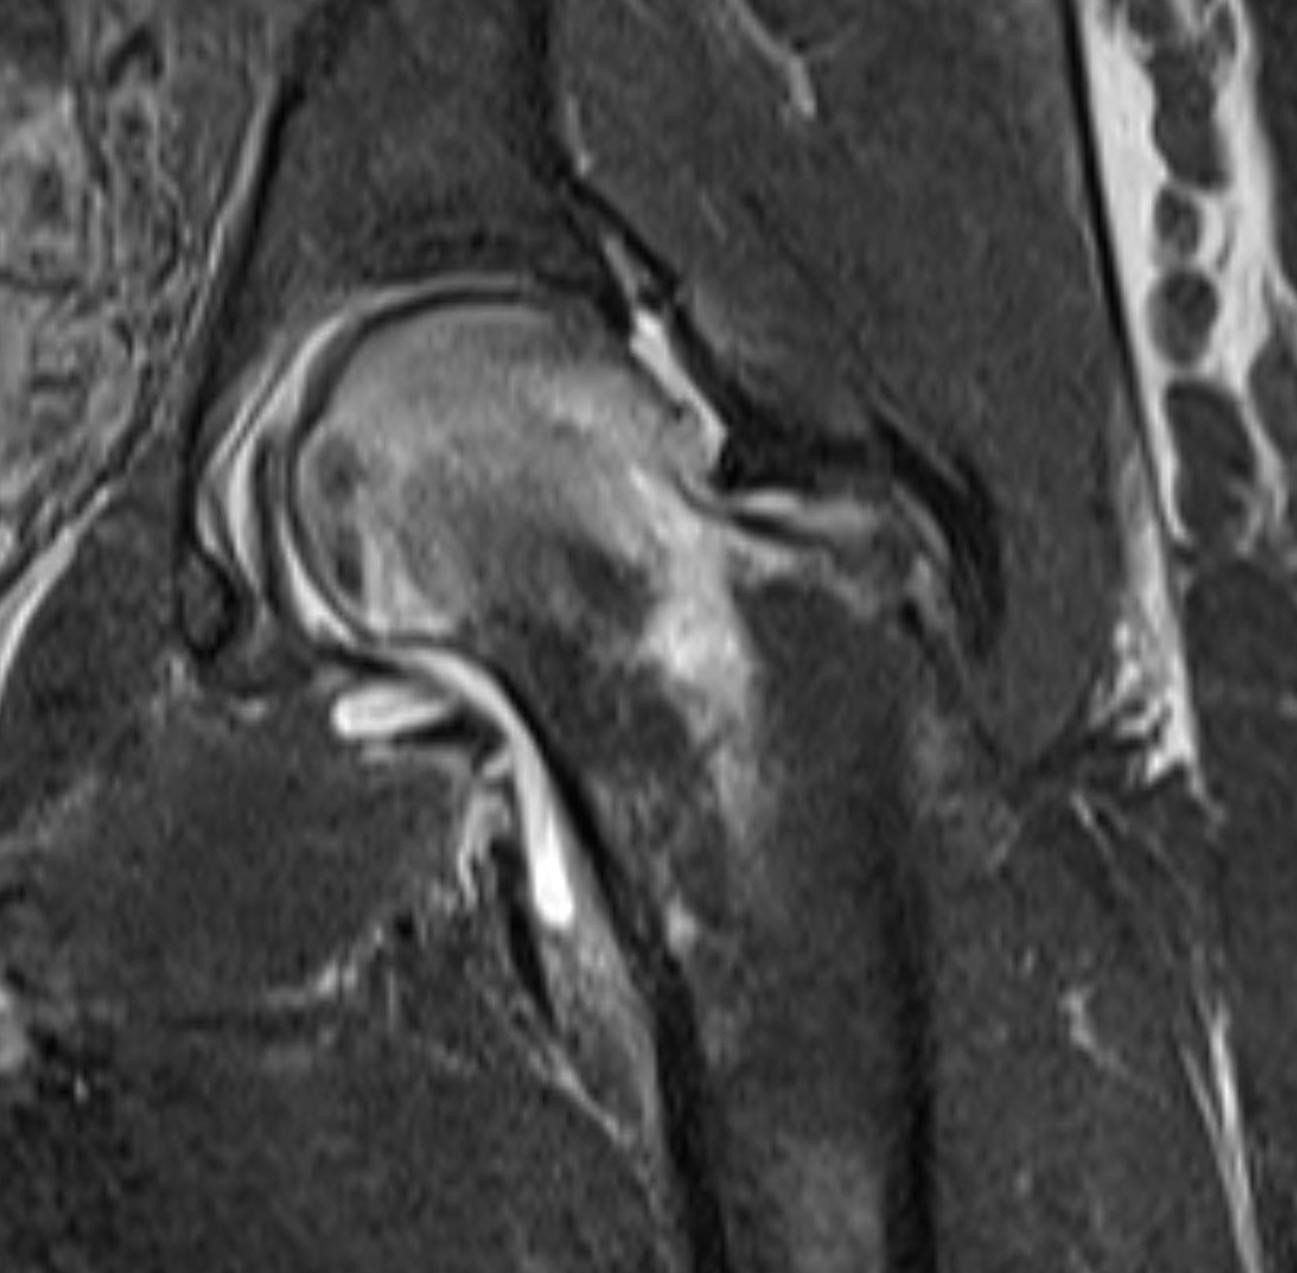
A coronal T2 image from an MRI of the left hip demonstrates extensive T2 hyperintense signal throughout the left femoral head and neck, corresponding to the areas of lucency on the radiograph. No fracture line is seen and the joint space is preserved.
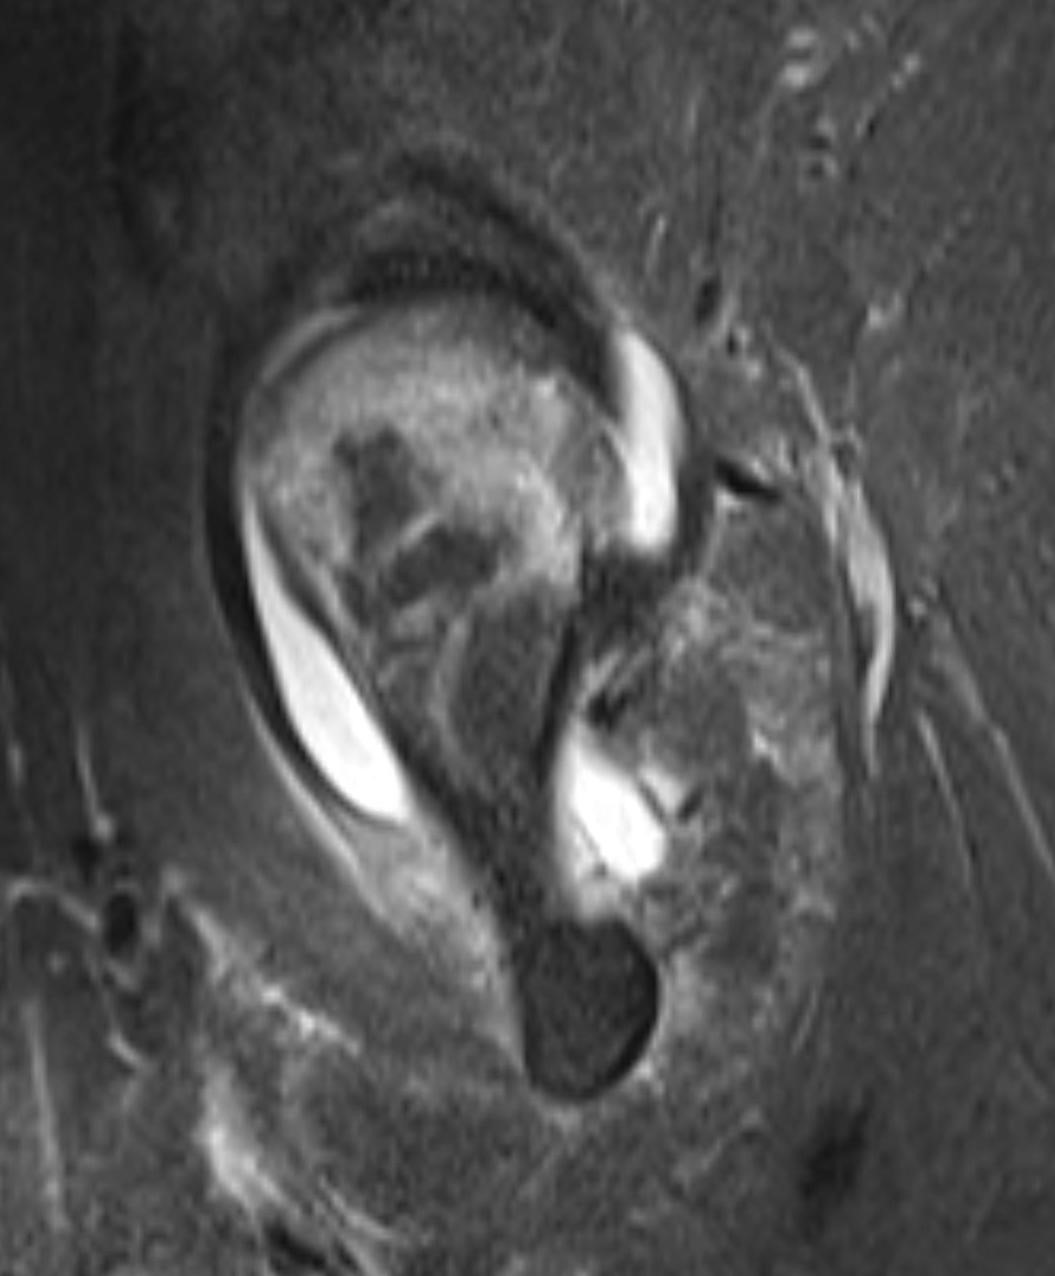
A sagittal T2 image from the left hip MRI demonstrates a small joint effusion.
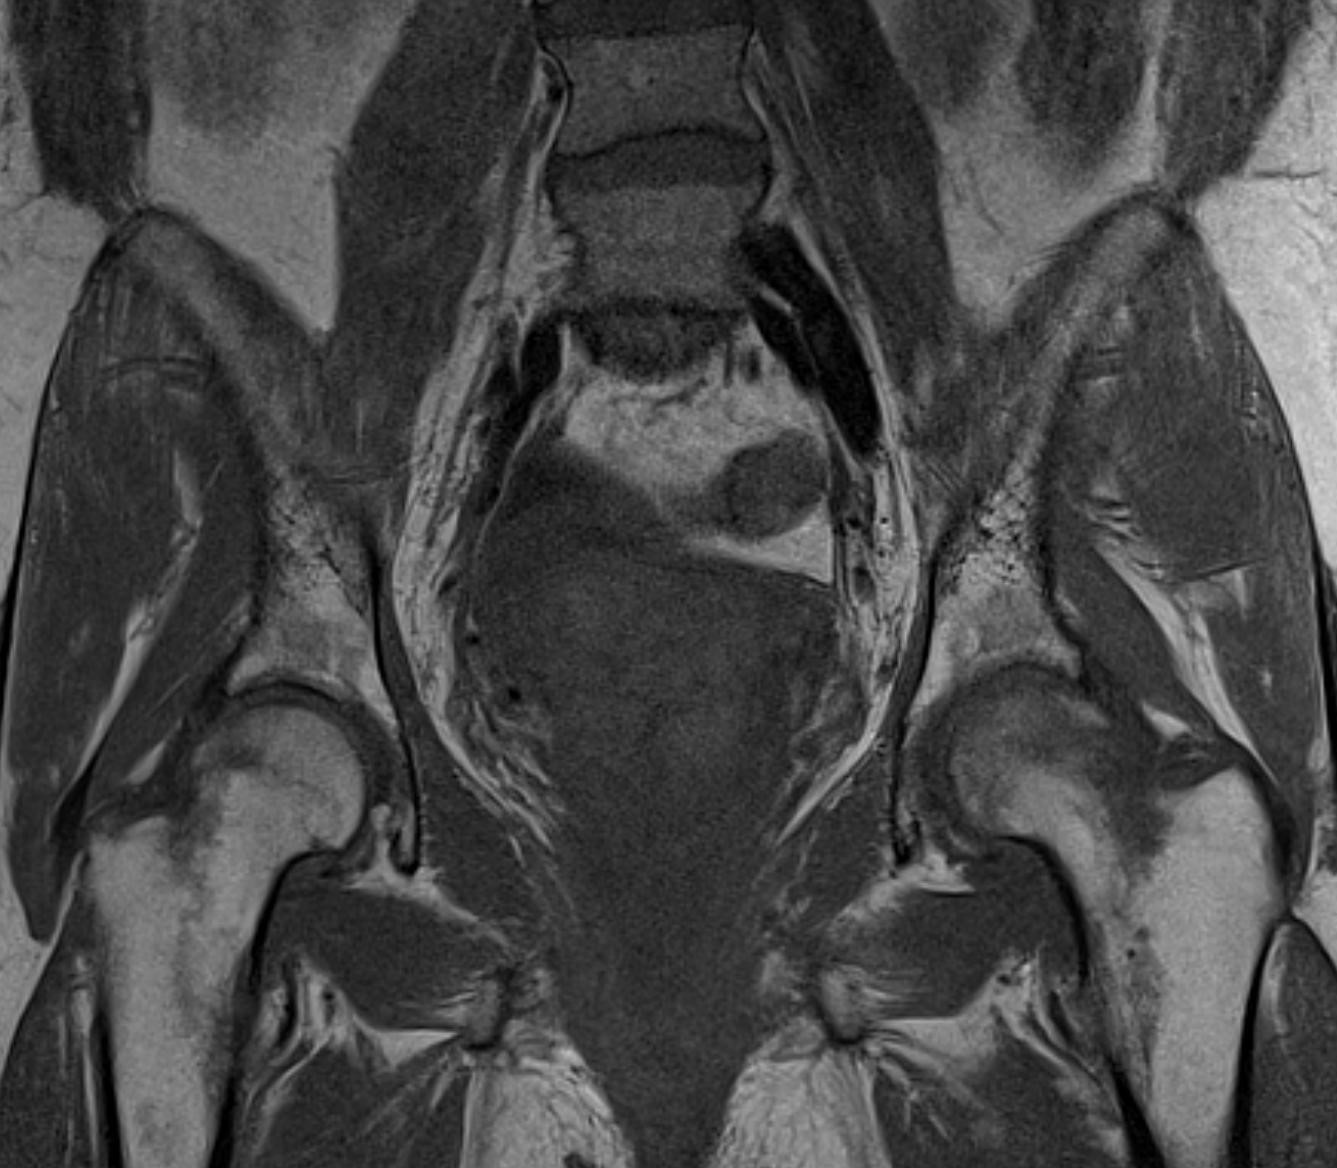
Coronal T1 MRI of the hips shows decreased T1 signal in the left femoral head and neck corresponding to the areas of T2 hyperintensity. In comparison, the right hip demonstrates normal bone marrow signals.
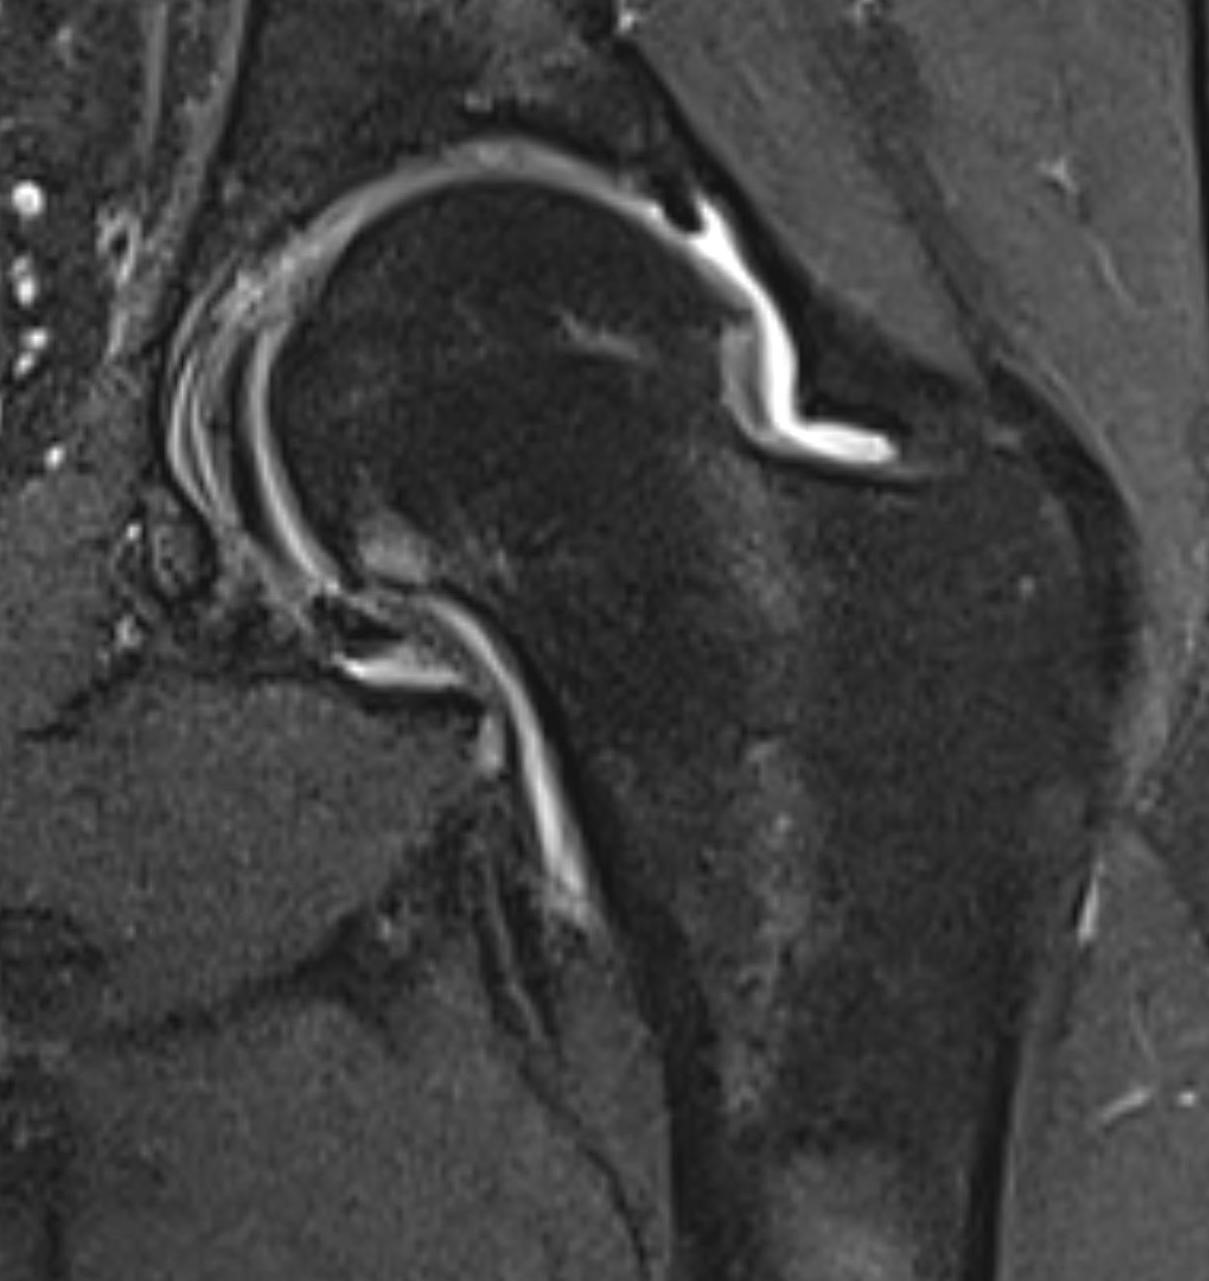
A follow-up MRI of the left hip 8 months after the previous imaging demonstrates near-complete resolution of the T2 hyperintense signal in the left femoral head and neck.
Diagnosis: Transient Osteoporosis of the Hip
Teaching Points:
Transient osteoporosis of the hip is a classic cause of hip pain in pregnant females, most often presenting during the 3rd trimester. However, it actually occurs more frequently in middle-aged men. Pain is usually progressive in onset over several weeks. The etiology is unknown, but it is thought to be vascular in etiology, possibly related to venous obstruction with localized hyperemia.
On imaging, the findings are usually unilateral. Plain radiographs show severe loss of bone mineral density of the affected hip with subchondral cortical loss. On MRI, there will be extensive T2 hyperintensity and T1 hypointensity of the femoral head and neck consistent with bone marrow edema. A small joint effusion is often present.
Transient osteoporosis of the hip usually resolves spontaneously within 6-8 months, as seen in the case shown above. As such, conservative management with pain control and protected weight-bearing is the management. In a minority of cases, patients may develop an insufficiency fracture.
References:
1. Malizos KN, Zibis AH, et al. MR imaging findings in transient osteoporosis of the hip. European Journal of Radiology. 2004; 50(3): 238-244.
2. Geith T, Niethammer T, et al. Transient Bone Marrow Edema Syndrome versus Osteonecrosis: Perfusion Patterns at Dynamic Contrast-enhanced MR Imaging with High Temporal Resolution Can Allow Differentiation. Radiology. 2016; 283(2): 478-485.
3. Berman N, Brent H, et al. Transient Osteoporosis: Not just the hip to worry about. Bone Reports. 2016; 5: 308-311.
January 24, 2022: Leriche Syndrome (Aortoiliac Occlusive Disease)
History: 75-year-old male presented to the Emergency Department with impotence and buttock claudication.
Findings:
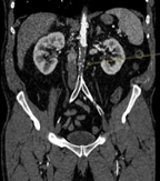
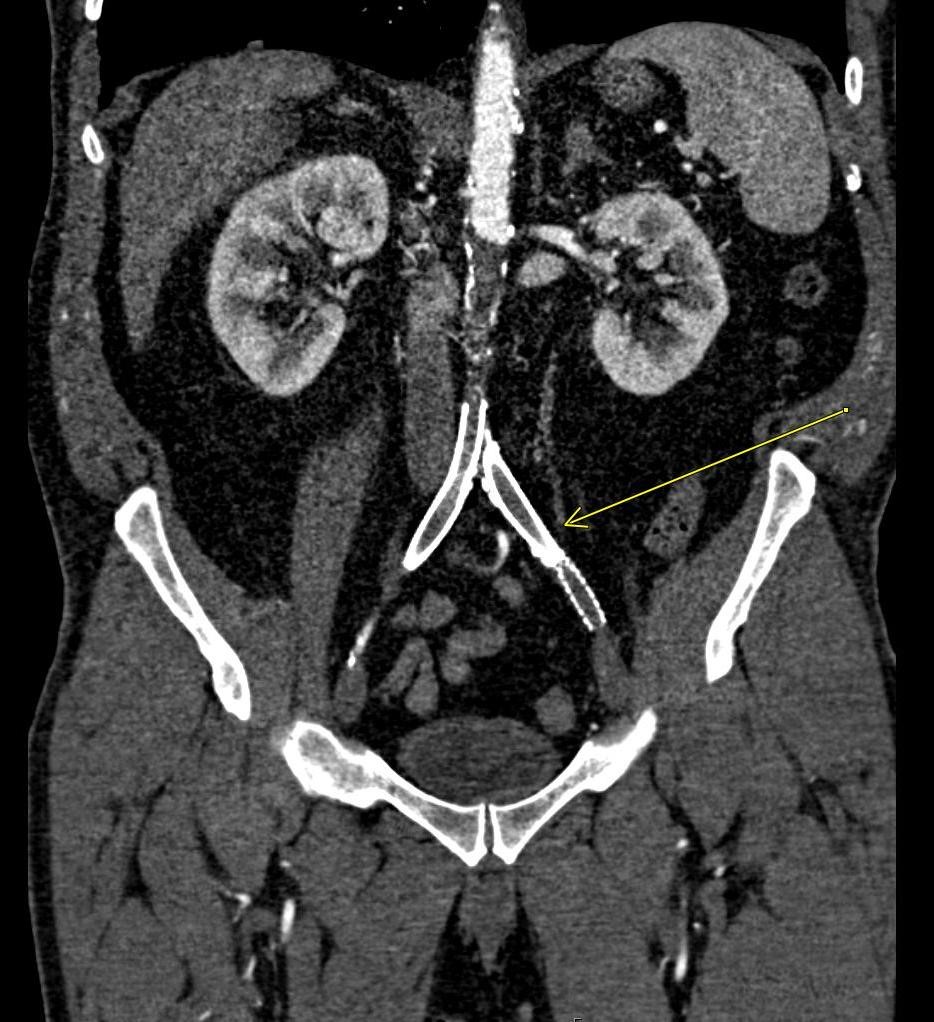
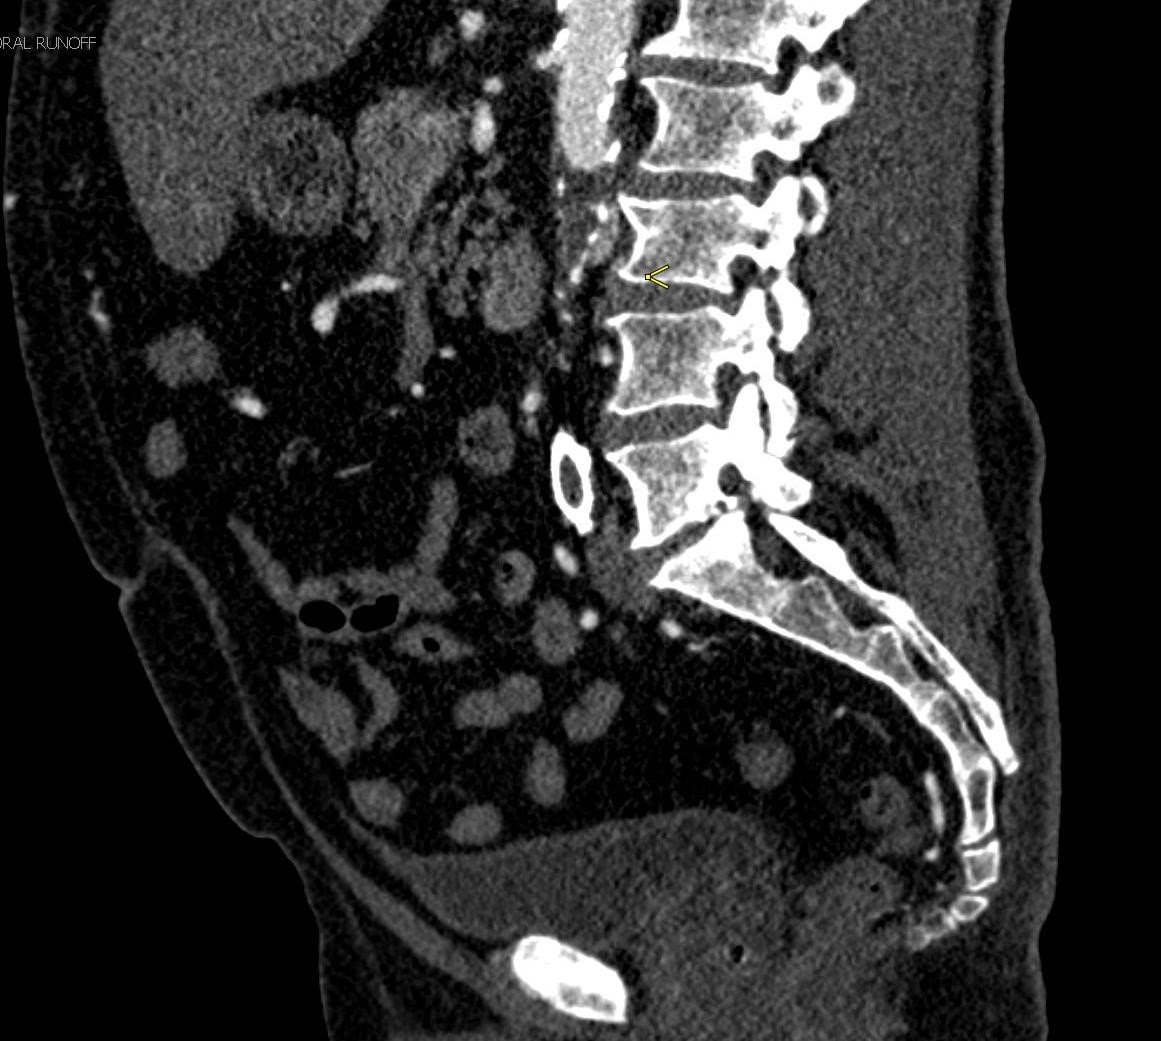
Coronal and sagittal CT angiogram of the abdominal aorta demonstrates two kissing aortoiliac stents extending from the distal infrarenal abdominal aorta to the proximal iliac arteries bilaterally.
There is complete occlusion of the infrarenal abdominal aorta just below the takeoff of the renal arteries. The occlusion extends throughout the aortoiliac stents, with revascularization at the level of the common femoral arteries. There is scattered calcified atherosclerotic plaque within the opacified and non-opacified abdominal aorta.
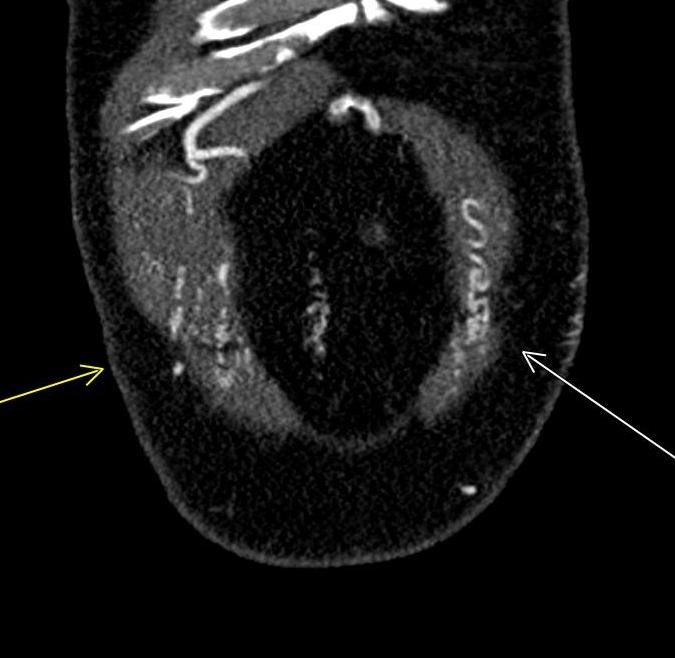
A coronal image of the anterior abdominal wall demonstrates prominent collateral vessels. Other images showed prominent internal thoracic, superior epigastric, inferior epigastric, and external iliac vessels.
Diagnosis: Leriche Syndrome (Aortoiliac Occlusive Disease)
Teaching Points:
Leriche Syndrome is complete occlusion of the abdominal aorta distal to the renal arteries. These patients present with a classic clinical triad of 1) impotence/erectile dysfunction, 2) pelvis and thigh claudication, and 3) absent femoral pulses. This disease most commonly presents in elderly males with advanced atherosclerosis but can affect younger males in their 30s-40s as well. The occlusion typically begins at the distal aorta near the bifurcation or at the proximal common iliac arteries and progresses proximally over time. While atherosclerosis is by far the most common etiology, acute thrombosis of vasculitis can also be a cause.
Type 1 is confined to the distal abdominal aorta and common iliac arteries.
Type 2 extends into the external iliac arteries.
Type 3 extends into the femoropopliteal arteries.
The chronic onset of the aortoiliac occlusion leads to the formation of multiple collateral vessels, as seen in the above example. One of the most common collateral pathways is called the Winslow pathway, which involves the internal thoracic, superior epigastric, inferior epigastric, and external iliac arteries. Another common pathway involves the lumbar, iliolumbar, sacral, inferior epigastric, and deep circumflex iliac arteries. The formation of these collateral pathways results in many of these patients remaining asymptomatic despite extensive occlusion, and as a result, this can be an incidental diagnosis on imaging.
CT or MR angiography is the imaging test of choice.
Treatment options include endarterectomy, bypass, or percutaneous transluminal angioplasty with stenting.
References:
- Takigawa M, Akutsu K, et al. Angiographic documentation of aortoiliac occlusion in Leriche’s Syndrome. The Canadian Journal of Cardiology. 2008; 24(7): 568.
- Ahmed S, Raman S, et al. CT angiography and 3D imaging in aortoiliac occlusive disease: collateral pathways in Leriche syndrome. Abdom Radiol. 2017; 42(9): 2346-2357.
- Rodriguez S, Sandoval F. Aortoiliac occlusive disease, a silent syndrome. BMJ Case Rep. 2019; 12(7): e230770.
- Hardman R, Lopera J, et al. Common and Rare Collateral Pathways in Aortoiliac Occlusive Disease: A Pictorial Essay. American Journal of Roentgenology. 2011; 197(3): 519-524.
January 10, 2021: Multiple Manifestations of Tuberculosis
History: 60-year-old female presented to the Emergency Department with neck pain and shortness of breath.
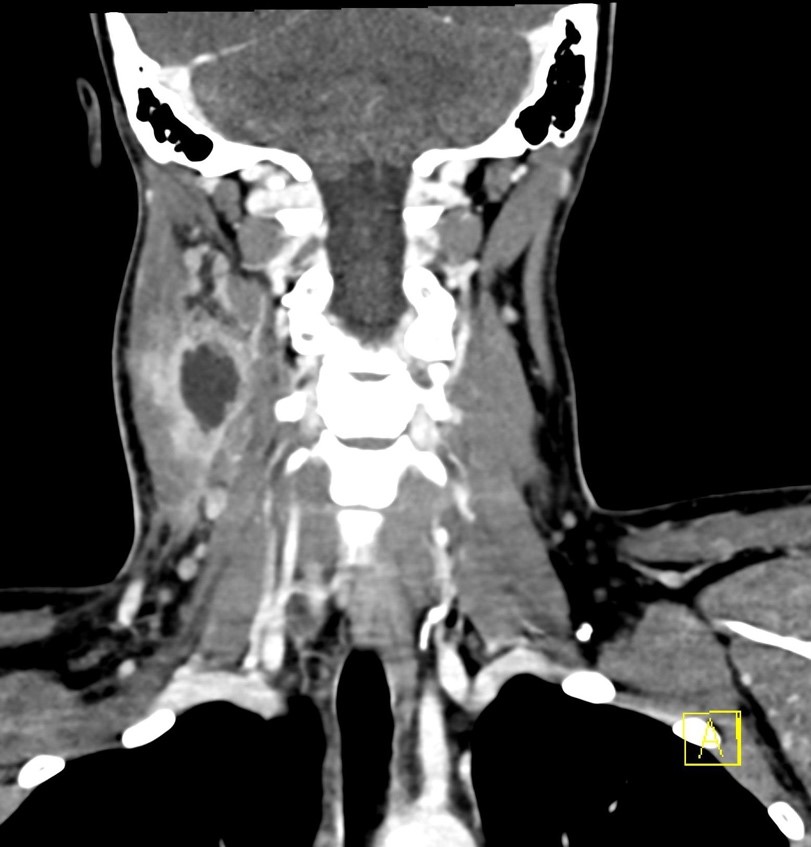
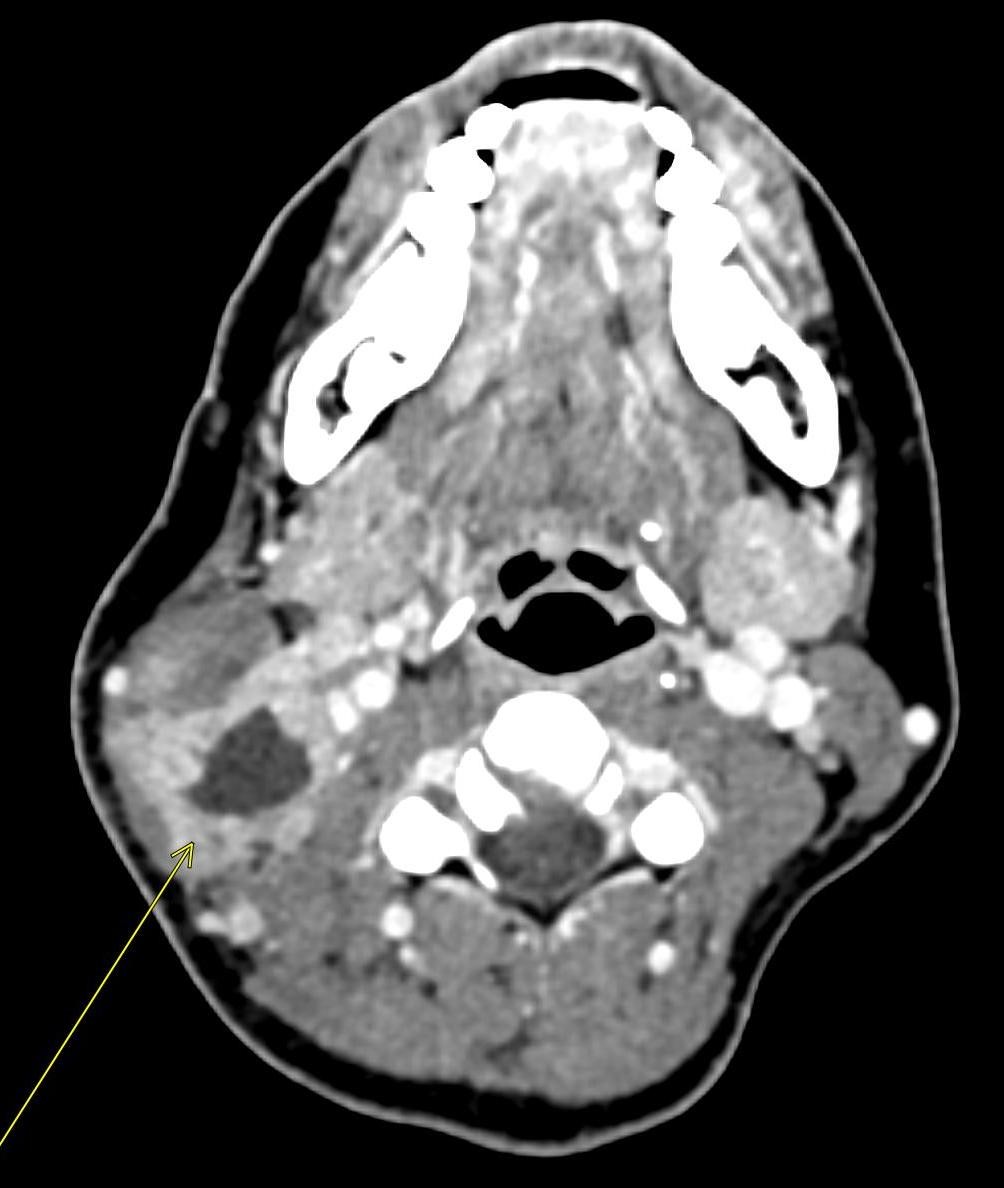
Coronal and axial CT of the neck demonstrates a peripherally-enhancing lesion in the lateral right neck (cervical level IIb nodal station) with central low density and surrounding inflammatory changes. There is associated compression of the right internal jugular vein, which remains patent.
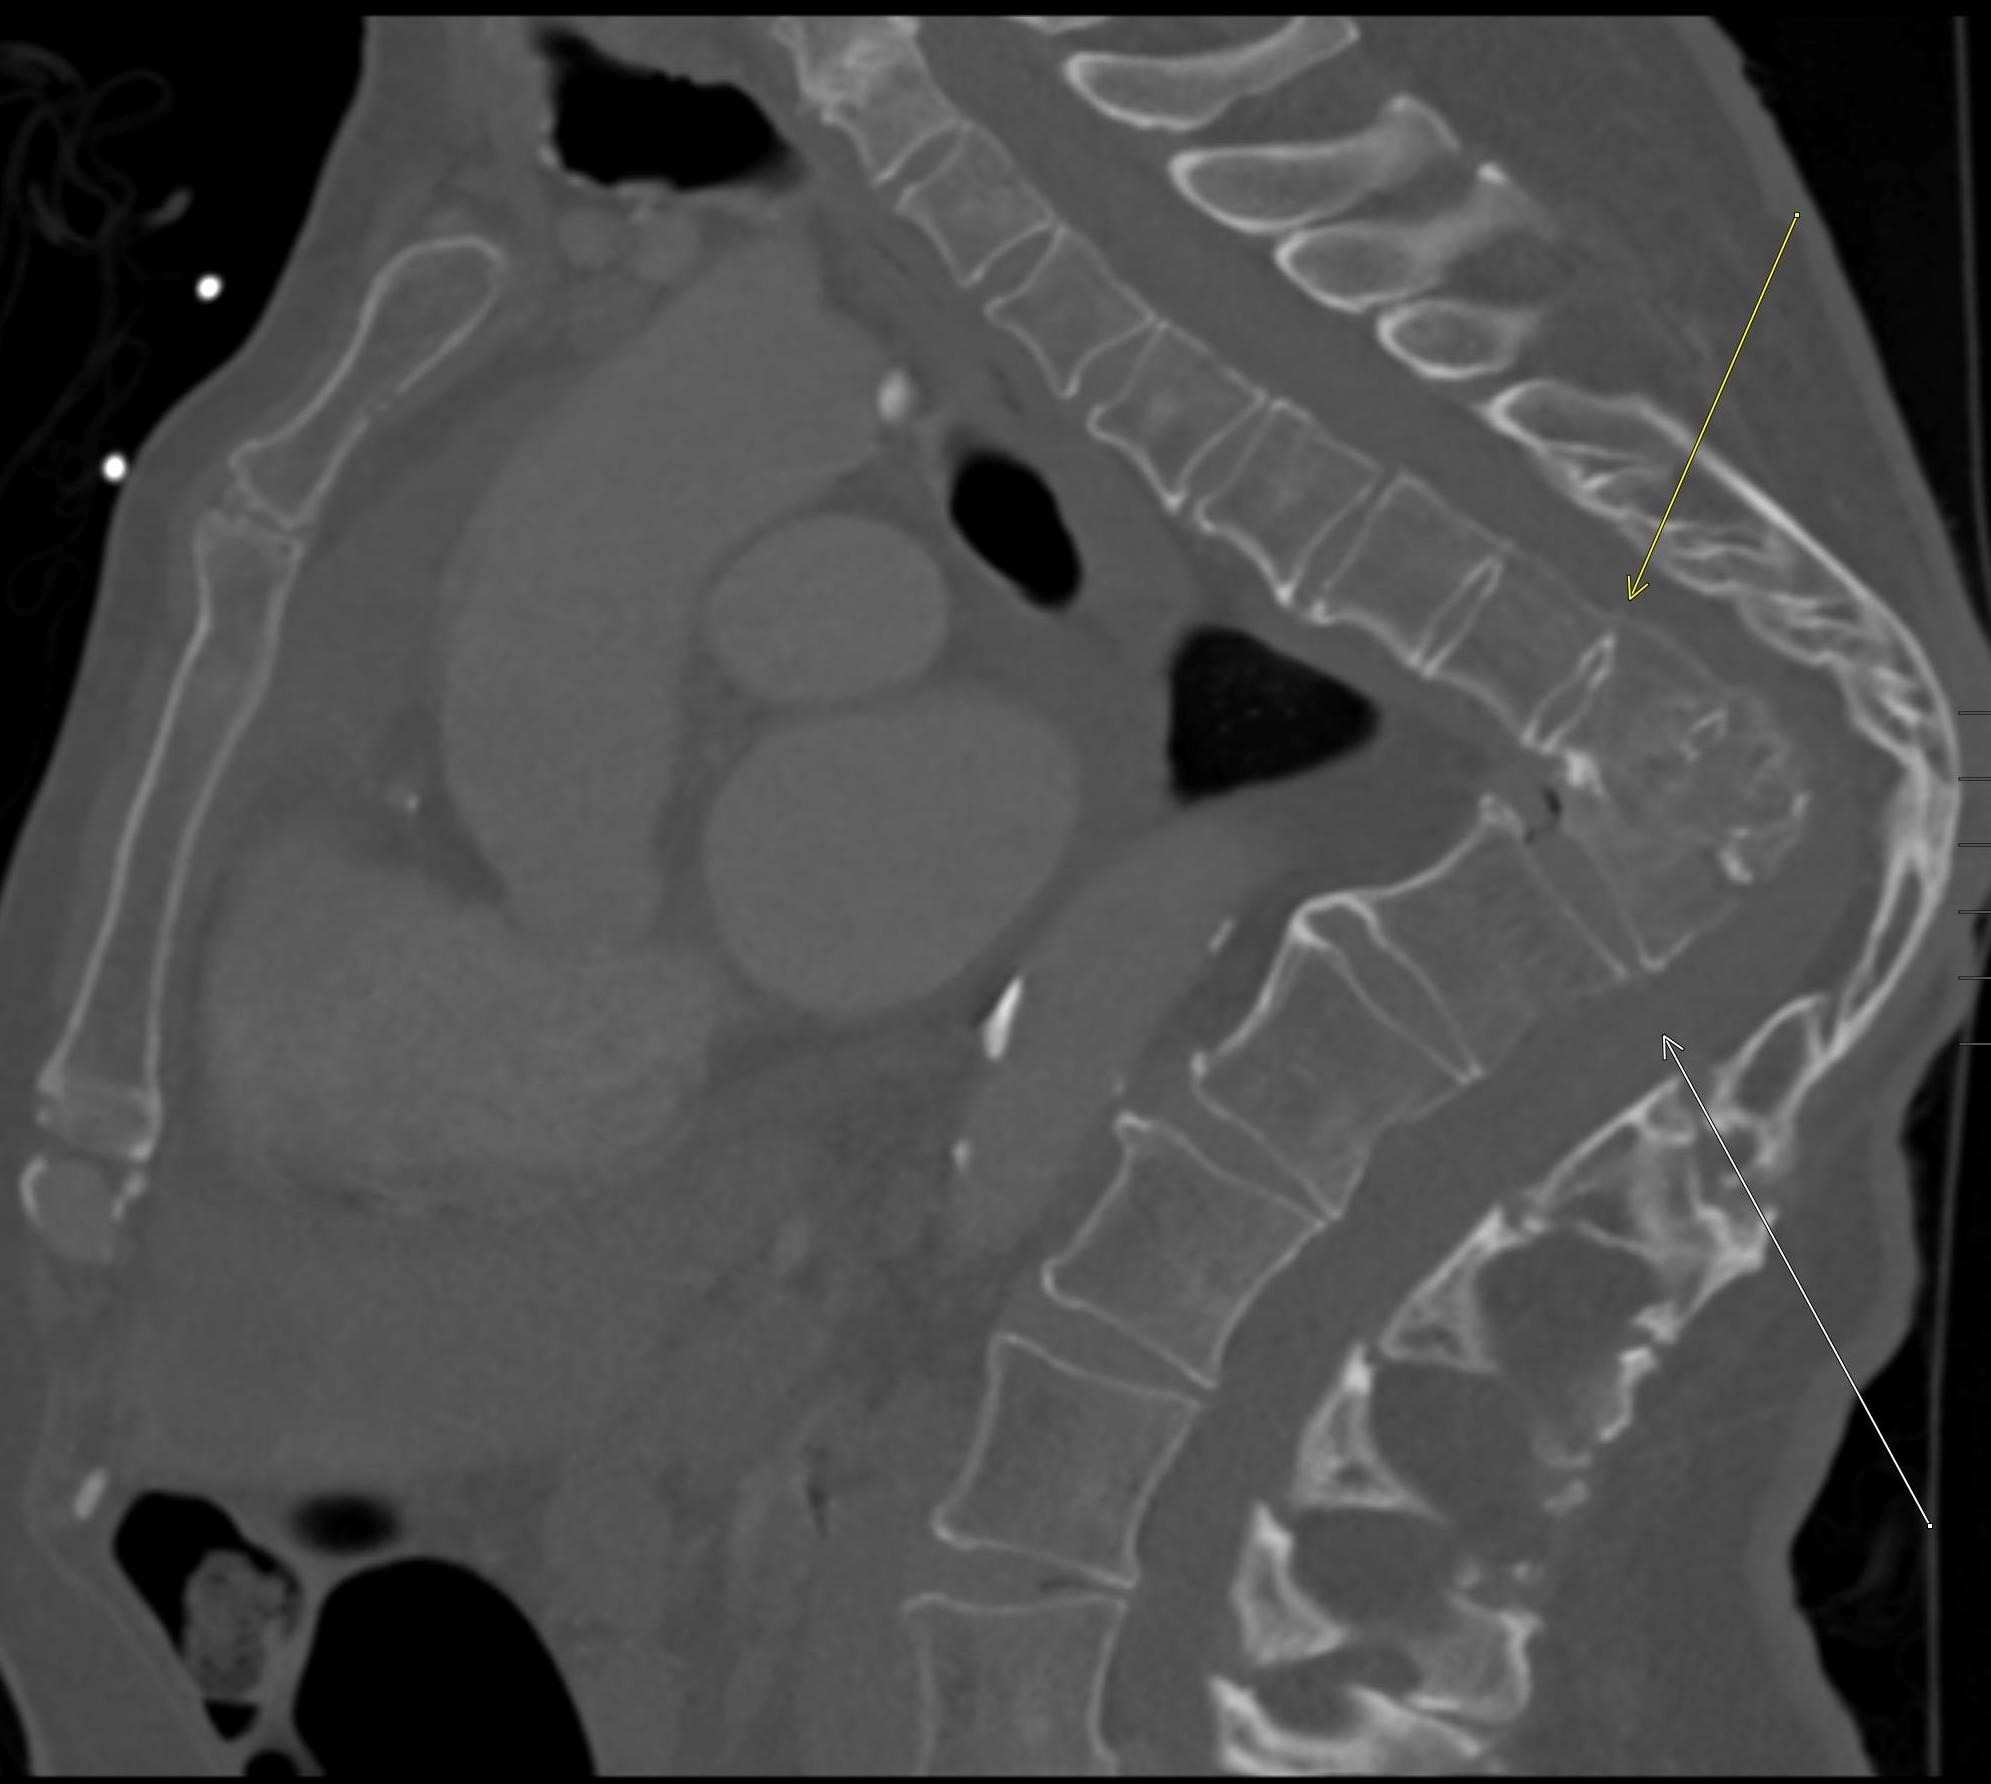
Sagittal CT of the thoracic spine demonstrates a short segment of severe thoracolumbar kyphosis with fusion of a few vertebrae, resulting in sharp angulation and narrowing of the spinal canal.
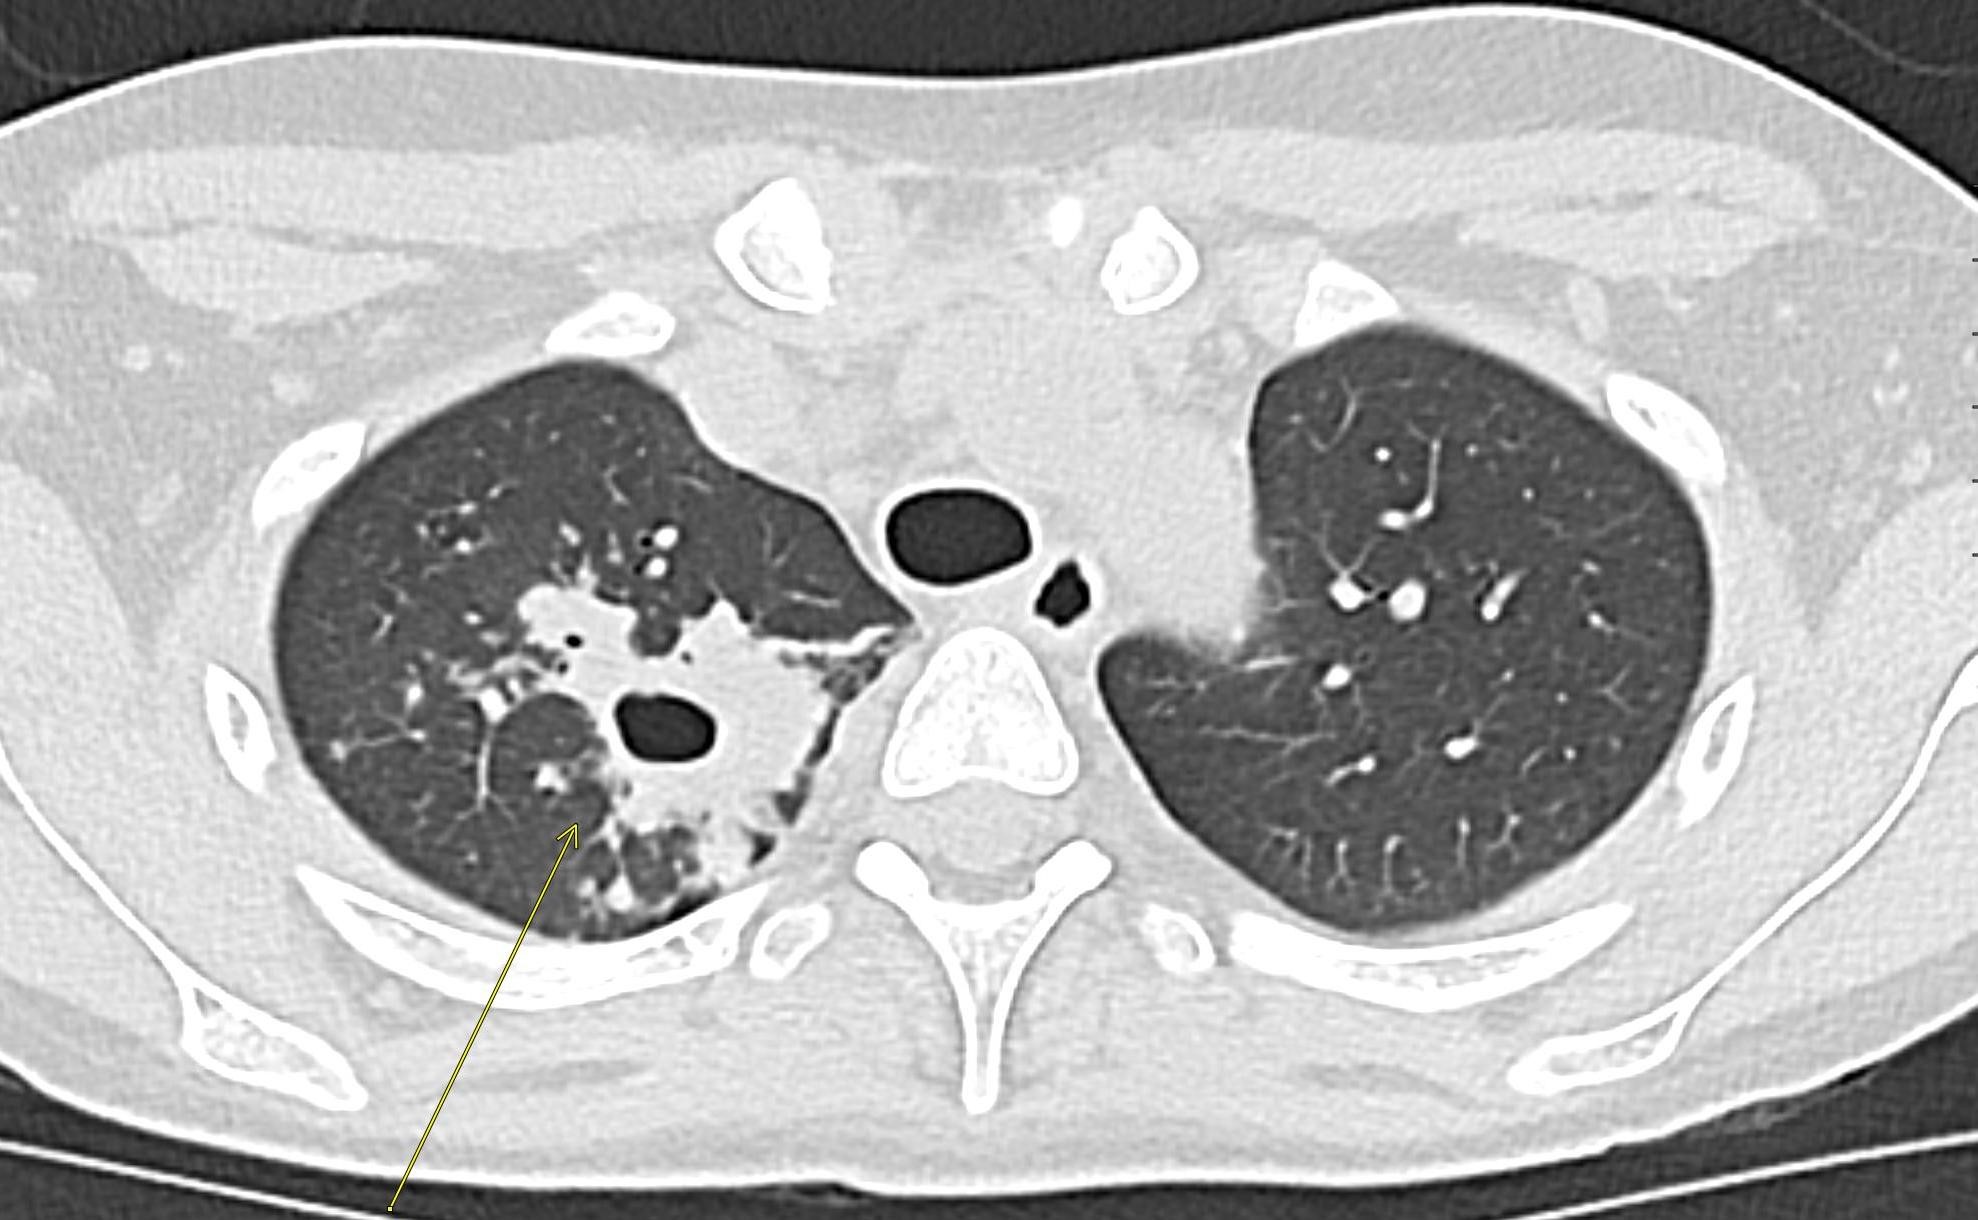
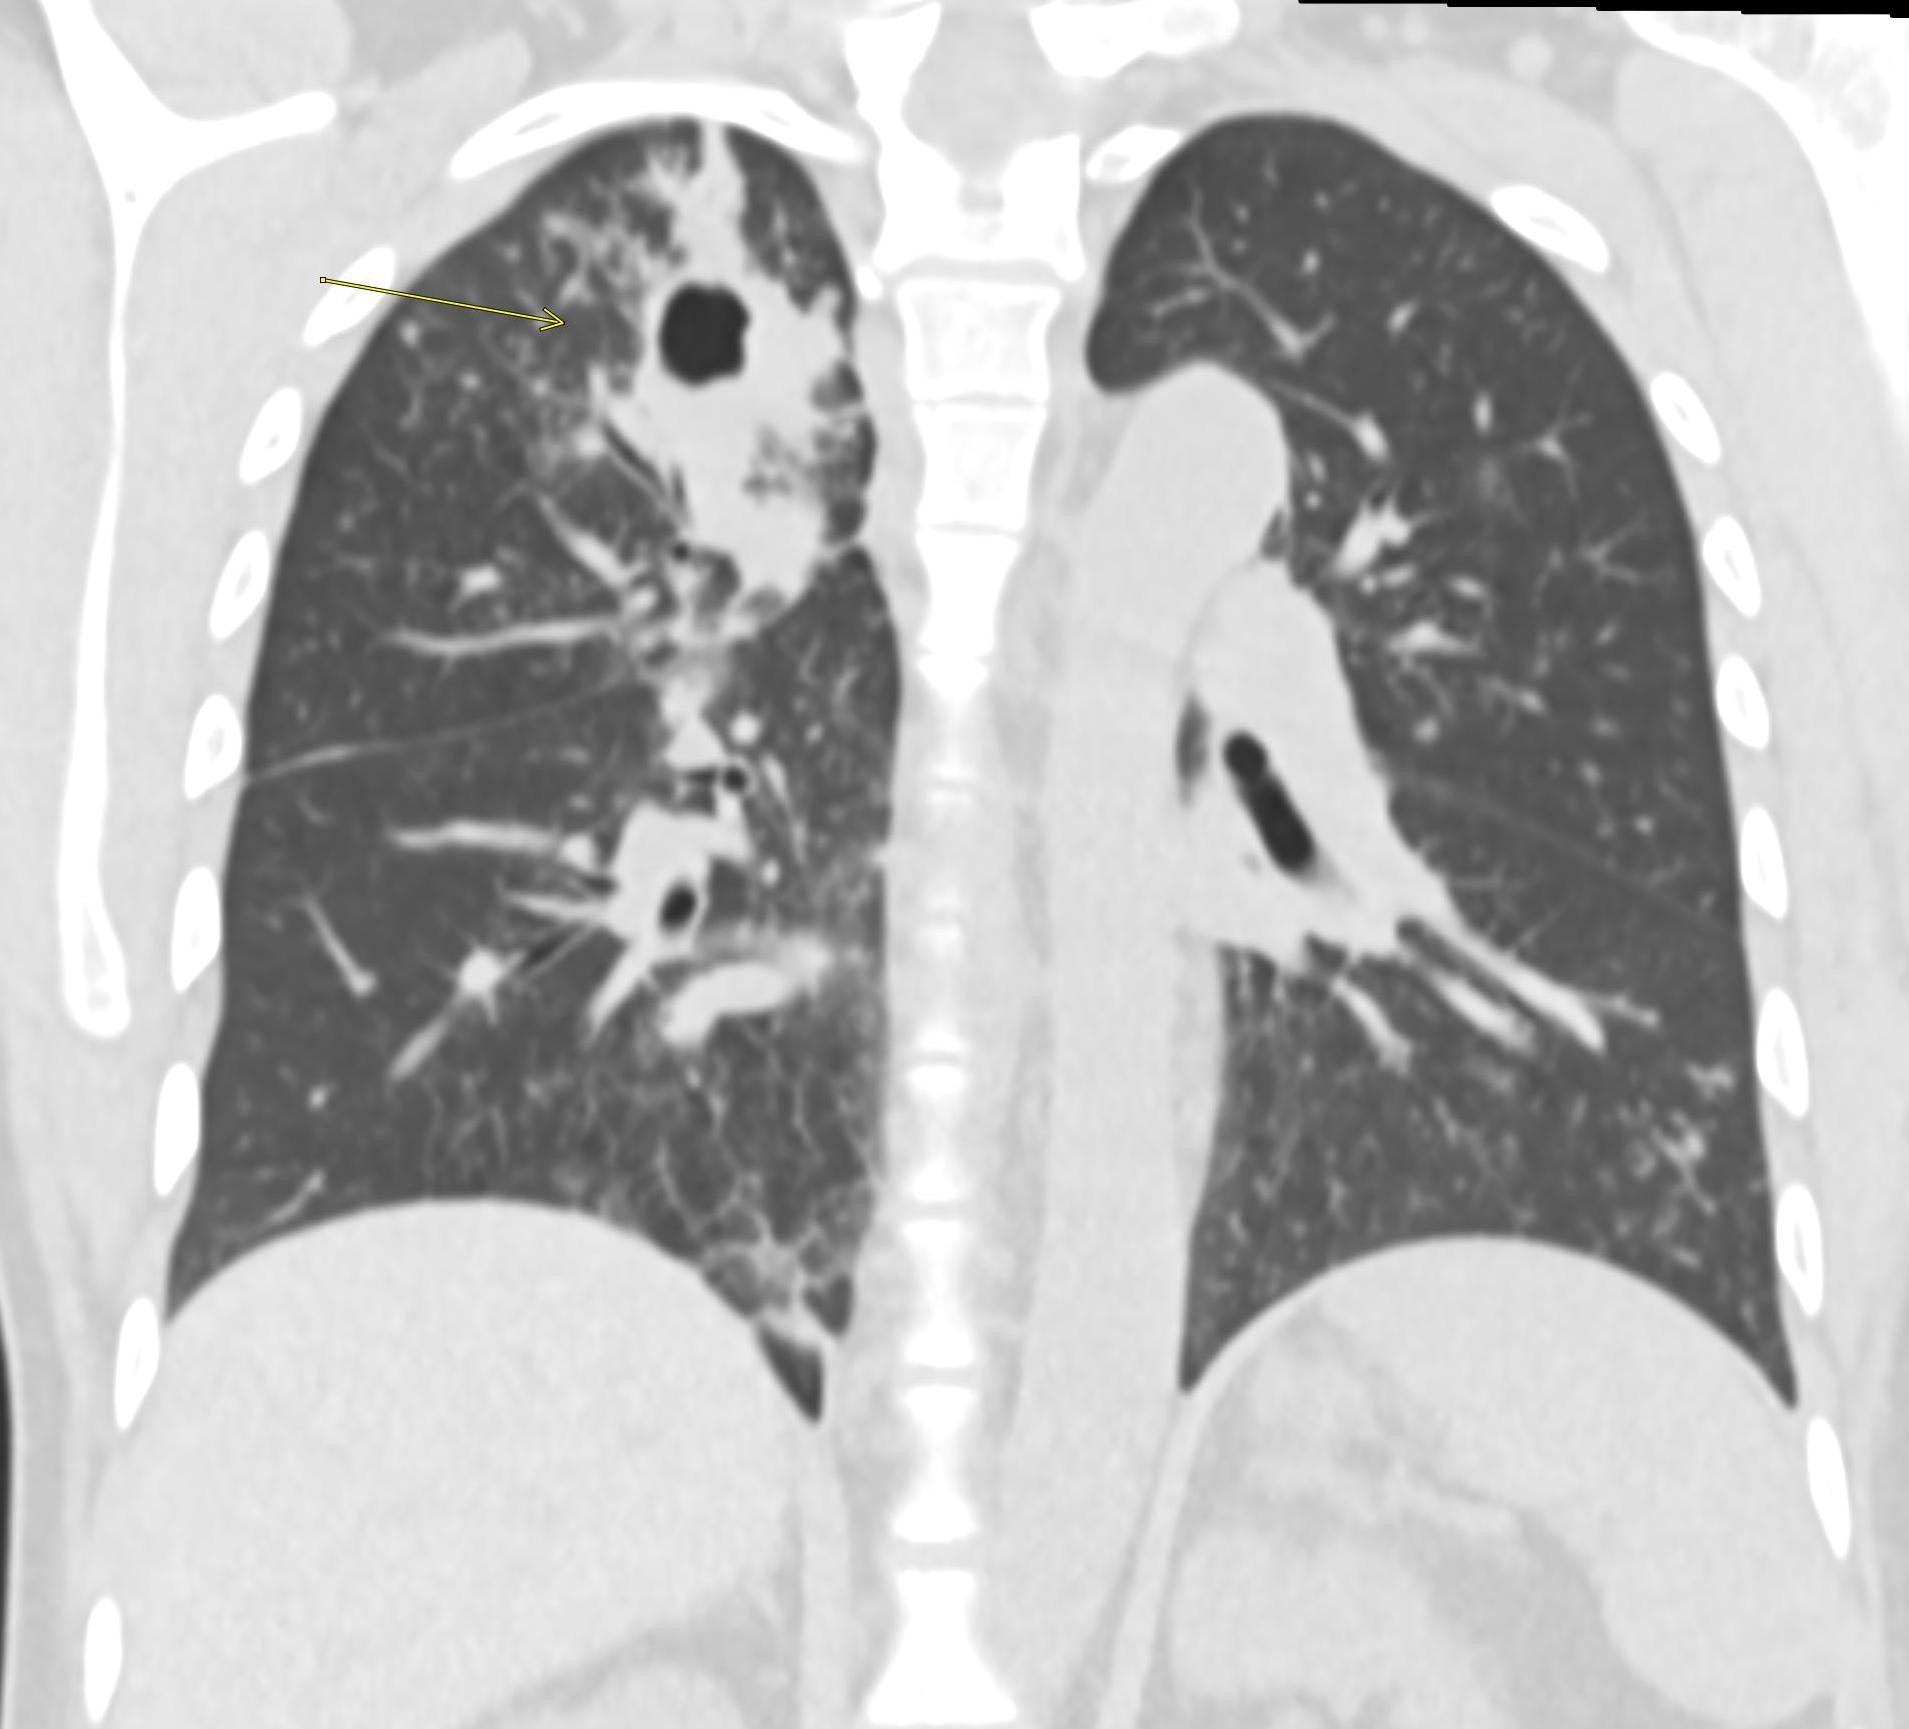
Axial and coronal CT of the chest demonstrates a right upper lobe cavitary lesion with surrounding tree-in-bud nodularity.
Diagnosis: Multiple manifestations of tuberculosis
Teaching Point:
Tuberculosis, caused by Mycobacterium tuberculosis, is a disease that can affect multiple organ and body systems as demonstrated in the case shown above. Advanced presentations such as this are most common in developing countries or immunocompromised patients including those with HIV/AIDS.
TB most commonly affects the lungs. Primary pulmonary TB (the initial focus of infection) can be located anywhere in the lungs and has a nonspecific imaging appearance, varying from dense parenchymal consolidation to lymphadenopathy to pleural effusions. Cavitation is uncommon in the primary TB. Eventually, the infection becomes localized and calcifies, forming a “Ghon lesion.” Ipsilateral hilar and mediastinal lymphadenopathy will also calcify and form the “Ranke complex.” In post-primary TB, the infection reactivates in the setting of decreased immune status. It most often affects the posterior upper lobes or superior lower lobes, and more often cavitates than primary TB. Endobronchial spread is also common and manifests as tree-in-bud nodularity.
Tuberculous cervical lymphadenitis, better known as “scrofula,” is the most common manifestation of tuberculosis outside the lungs and is seen with post-primary tuberculosis. Cervical lymph nodes are the most common site of involvement, and these patients usually present with unilateral neck swelling. Mediastinal and axillary lymphadenitis is less common. On imaging, you will see enlarged lymph nodes with central caseation or cystic change (low density centrally). Treatment involves antimycobacterial medication and possibly surgical excision if unsuccessful. Of note, percutaneous drainage is not performed for these lesions because it can increase the risk of fistulae. It is important to remember that a scrofula cannot be distinguished from other causes of cervical lymphadenitis by imaging alone, and patient history is critical.
Skeletal involvement of tuberculosis is relatively rare, with only 1-3% of TB patients affected. The spine is the most commonly affected site and can manifest as severe focal kyphosis (Gibbus deformity) or discitis-osteomyelitis (Pott’s disease). The classic imaging feature of TB spondylitis is relative preservation of the disc space (as opposed to bacterial discitis-osteomyelitis in which there is a greater degree of disc space height loss). There will often be irregularity of the endplates and anterior aspects of the vertebral bodies. Large paraspinal abscesses without significant surrounding inflammatory change (“cold abscess”) are also common and can help to differentiate from bacterial infection.
References:
- Burrill J, Williams C, et al. Tuberculosis: A Radiologic Review. 2007; 27 (5): 1255-1273.
- Harisinghani M, Mcloud T, et al. Tuberculosis from head to toe. 2000; 20 (2): 449-470.
- Leung A, et al. Pulmonary tuberculosis: the essentials. Radiology. 1999; 210 (2): 307-322.
December 14, 2021: Spinal Cord Infarct
History: 17-year-old male presents with chest pain, dyspnea, and generalized weakness. He was noted to be profoundly hypotensive and was resuscitated. Subsequently, the patient endorsed generalized weakness/numbness, worst in the lower extremities, and the inability to urinate.
Findings:
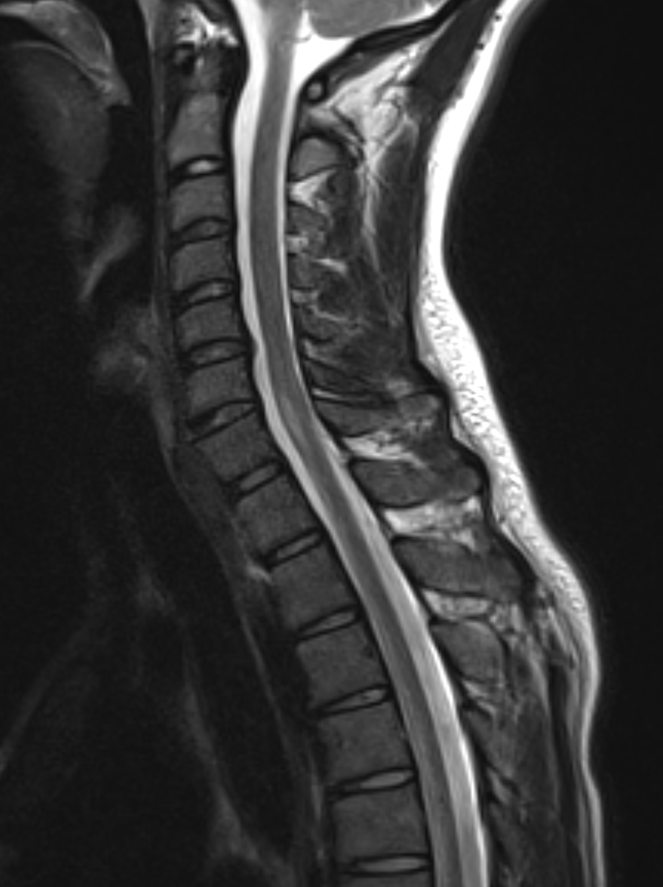
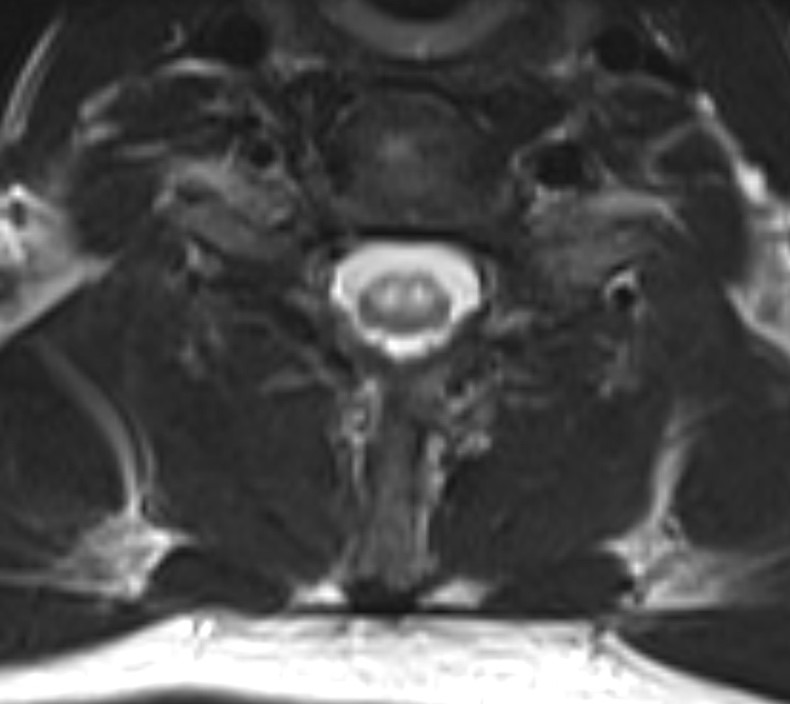
Sagittal T2 weighted MRI images through the cervical spine demonstrate abnormal high T2 signal originating at the C6-C7 spinal cord level. Axial imaging through the same level demonstrates a high T2 signal in the distribution of the anterior horns bilaterally.

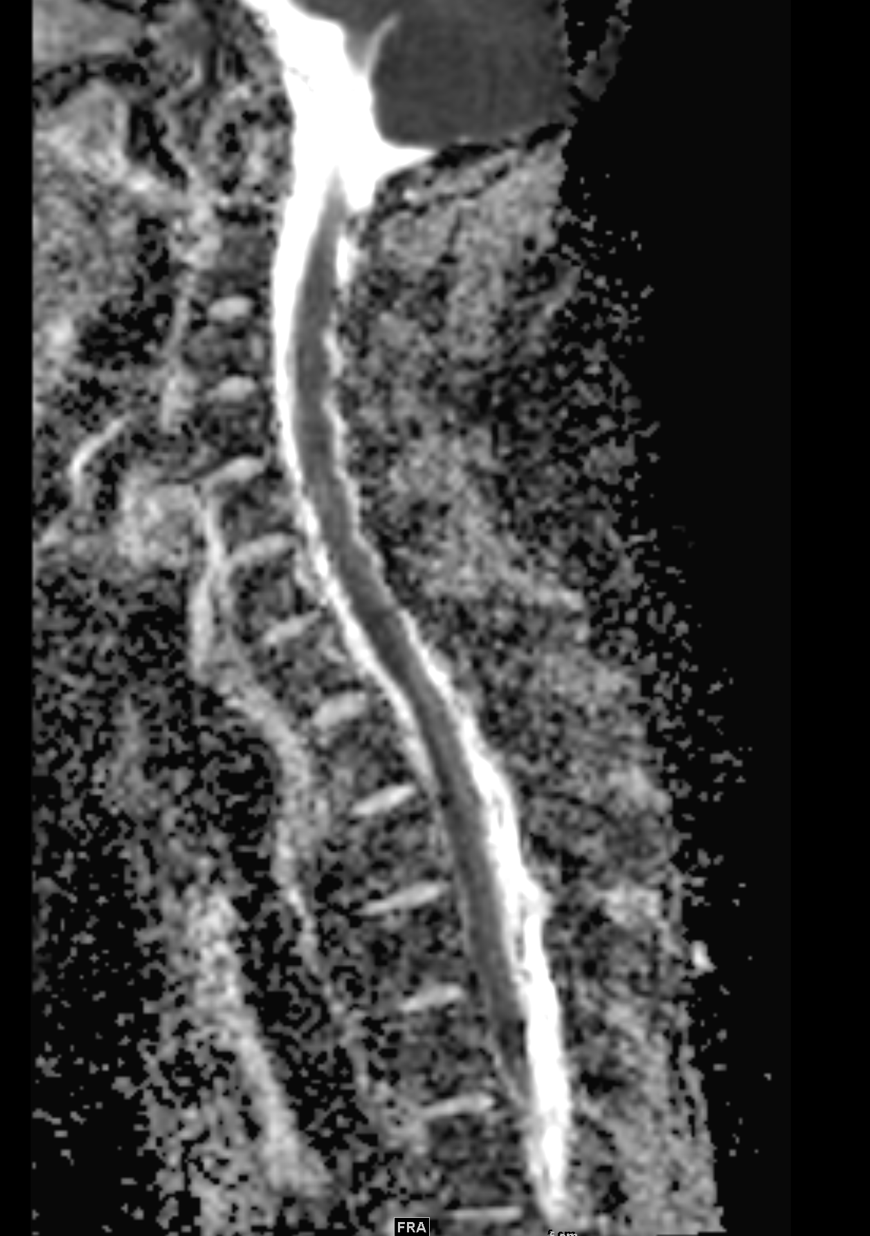
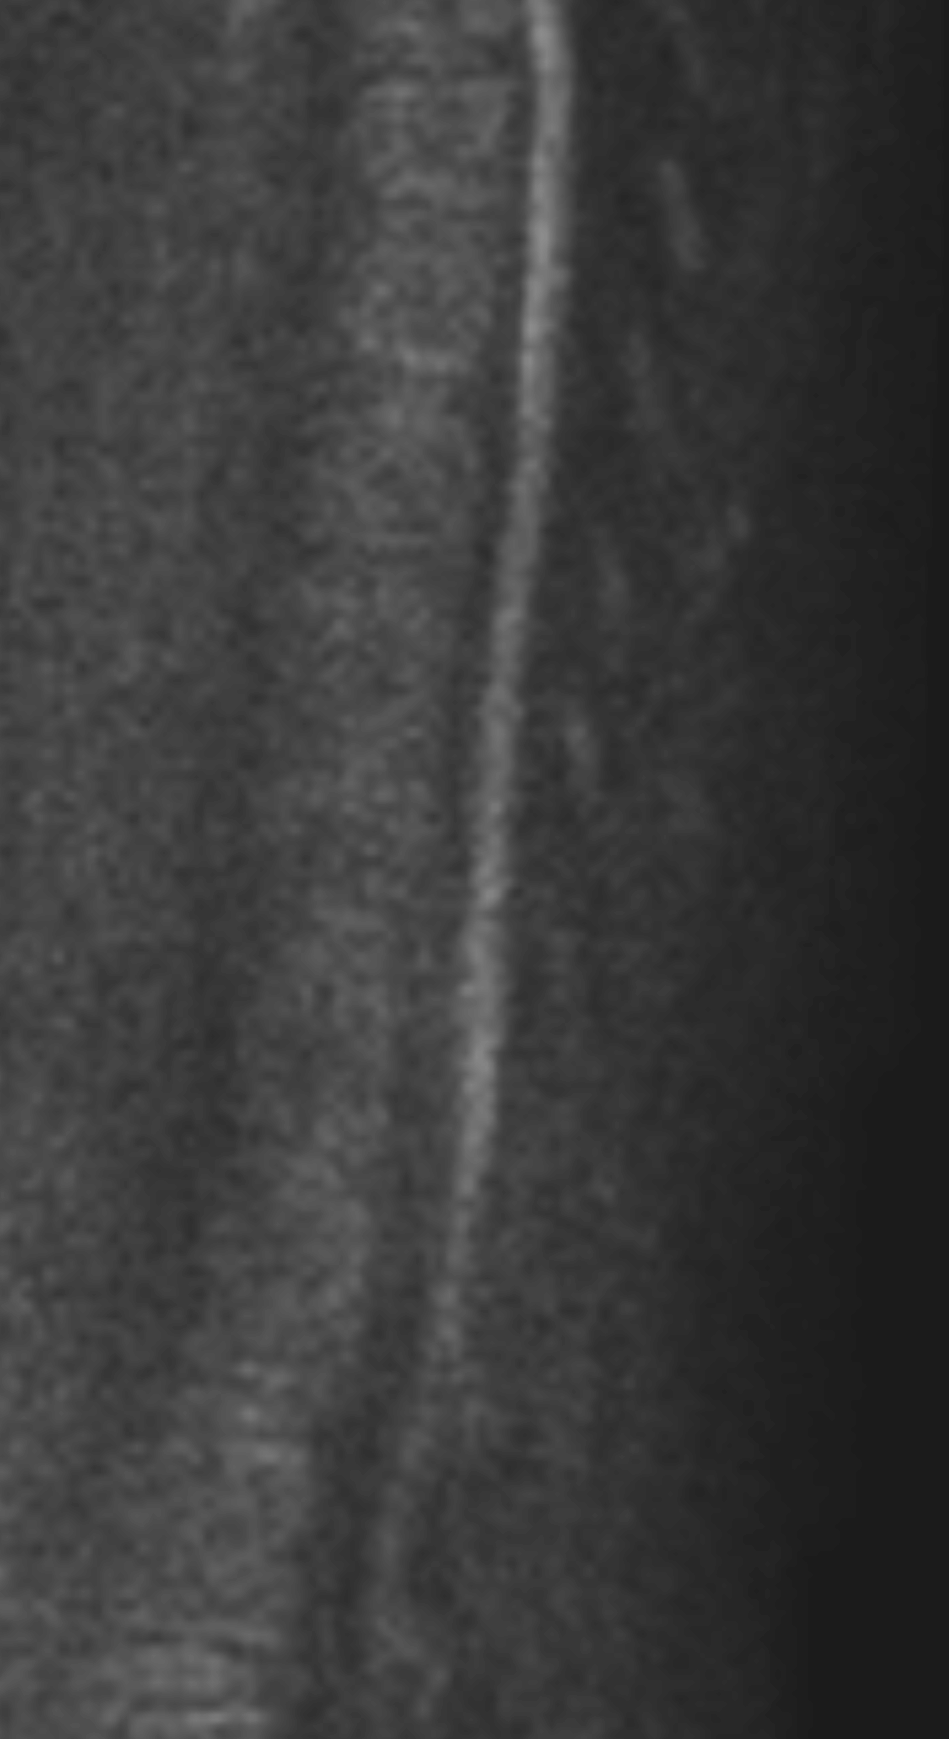
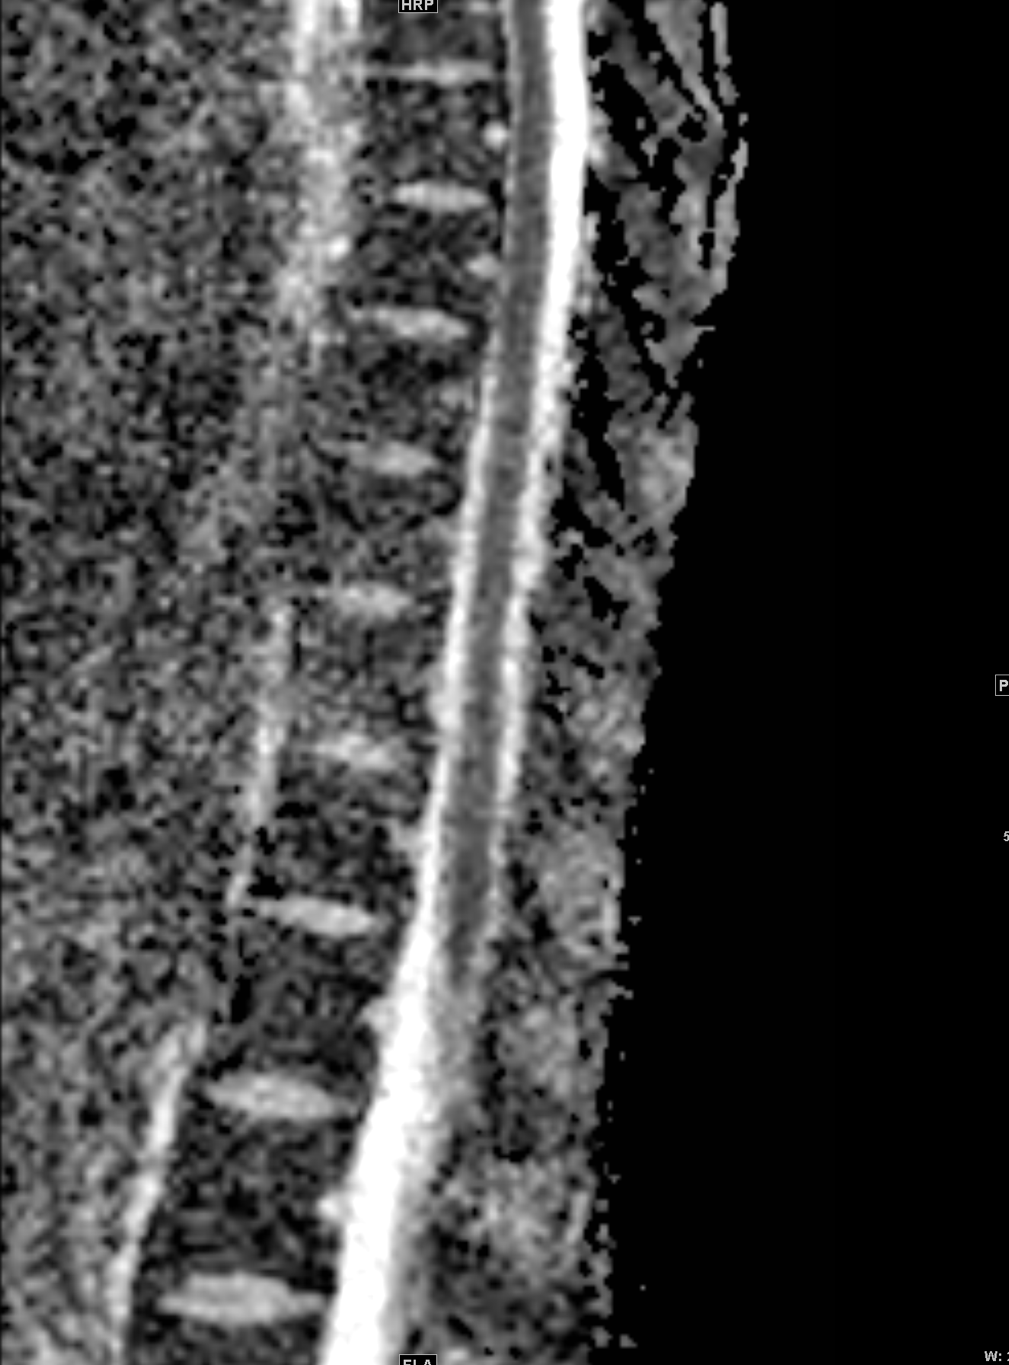
Sagittal ADC and DWI images through the cervical and thoracic spine demonstrate extensive restricted diffusion.
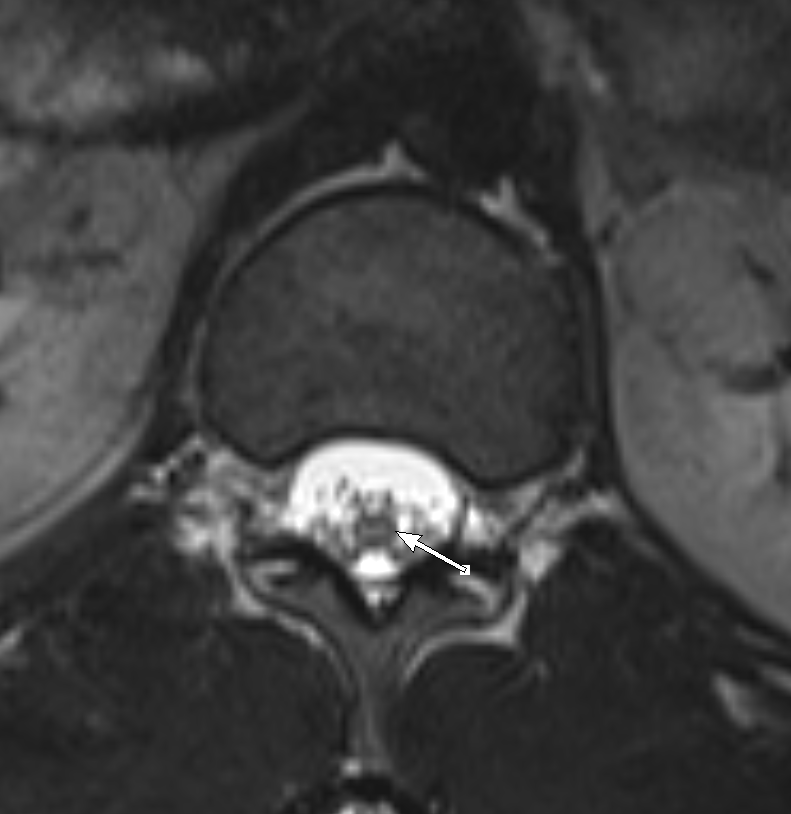
Axial T2 imaging through the conus at L2 demonstrates abnormal high T2 signal.
Diagnosis: Spinal cord infarct
Teaching Points: Spinal cord ischemia is a rare cause of myelopathy although the exact incidence is poorly defined. Etiologies vary from atherosclerotic disease, aortic surgery, systemic hypotension, spinal trauma, embolic states, and vasculitides. Spinal cord infarction most commonly occurs in the thoracolumbar spine. Symptoms are determined based on the arterial distribution: the anterior spinal artery (ASA), posterior spinal artery (PSA), or both may be involved. The ASA is more commonly affected; symptoms typically include bilateral extremity weakness, back pain, areflexia, and loss of pain and temperature sensation below the level of the infarct. PSA infarcts usually present with loss of vibration and proprioception below the level of insult due to involvement of the dorsal columns.
Whole spine MRI is the modality of choice for diagnosis, which will demonstrate hyperintense T2 signal within the cord. Classically, this is described as an “owl eye” or “snake eye” pattern, which refers to bilateral involvement of the anterior horns. There may be slight spinal cord expansion in the early phase and mild atrophy in the chronic phase. If severe, T1 hyperintensity within the ischemic cord may represent hemorrhagic conversion. The infarcted spinal cord will restrict diffusion on ADC/DWI imaging. Enhancement is typically absent in the acute stage but may be present in the subacute setting, often 1-2 weeks after the initial insult.
The primary differential diagnosis for spinal cord infarct includes transverse myelitis which also presents with imaging findings of linear T2 hyperintensity within the anterior portion of the cervical spinal cord. Diagnosis of transverse myelitis requires pleocytosis within the cerebrospinal fluid OR postcontrast enhancement between 4 hours and 21 days of symptom onset in a non-vascular distribution, which help differentiate this diagnosis from SCI.
Clinical management is dependent upon the etiology of SCI. In cases of systemic hypotension (such as with aortic surgery), mean arterial blood pressure must be kept above 90 mm Hg with the aid of volume resuscitation and pressors. SCI resulting from spinal cord compression secondary to a lesion or collection should be urgently resected or drained, respectively.
References:
Transverse Myelitis Consortium Working Group. Proposed diagnostic criteria and nosology of acute transverse myelitis. Neurology. 2002 Aug 27;59(4):499-505. doi: 10.1212/wnl.59.4.499. PMID: 12236201.
Nance JR, Golomb MR. Ischemic spinal cord infarction in children without vertebral fracture. Pediatr Neurol. 2007 Apr;36(4):209-16. doi: 10.1016/j.pediatrneurol.2007.01.006. PMID: 17437902; PMCID: PMC2001276.
Rubin MN, Rabinstein AA. Vascular diseases of the spinal cord. Neurol Clin. 2013 Feb;31(1):153-81. doi: 10.1016/j.ncl.2012.09.004. PMID: 23186899.
Yadav N, Pendharkar H, Kulkarni GB. Spinal Cord Infarction: Clinical and Radiological Features. J Stroke Cerebrovasc Dis. 2018 Oct;27(10):2810-2821. doi: 10.1016/j.jstrokecerebrovasdis.2018.06.008. Epub 2018 Aug 6. PMID: 30093205.
December 6, 2021: Intraosseous Hemangiomas
History: A 45-year-old male presented to the Emergency Department with hip pain.
Findings:
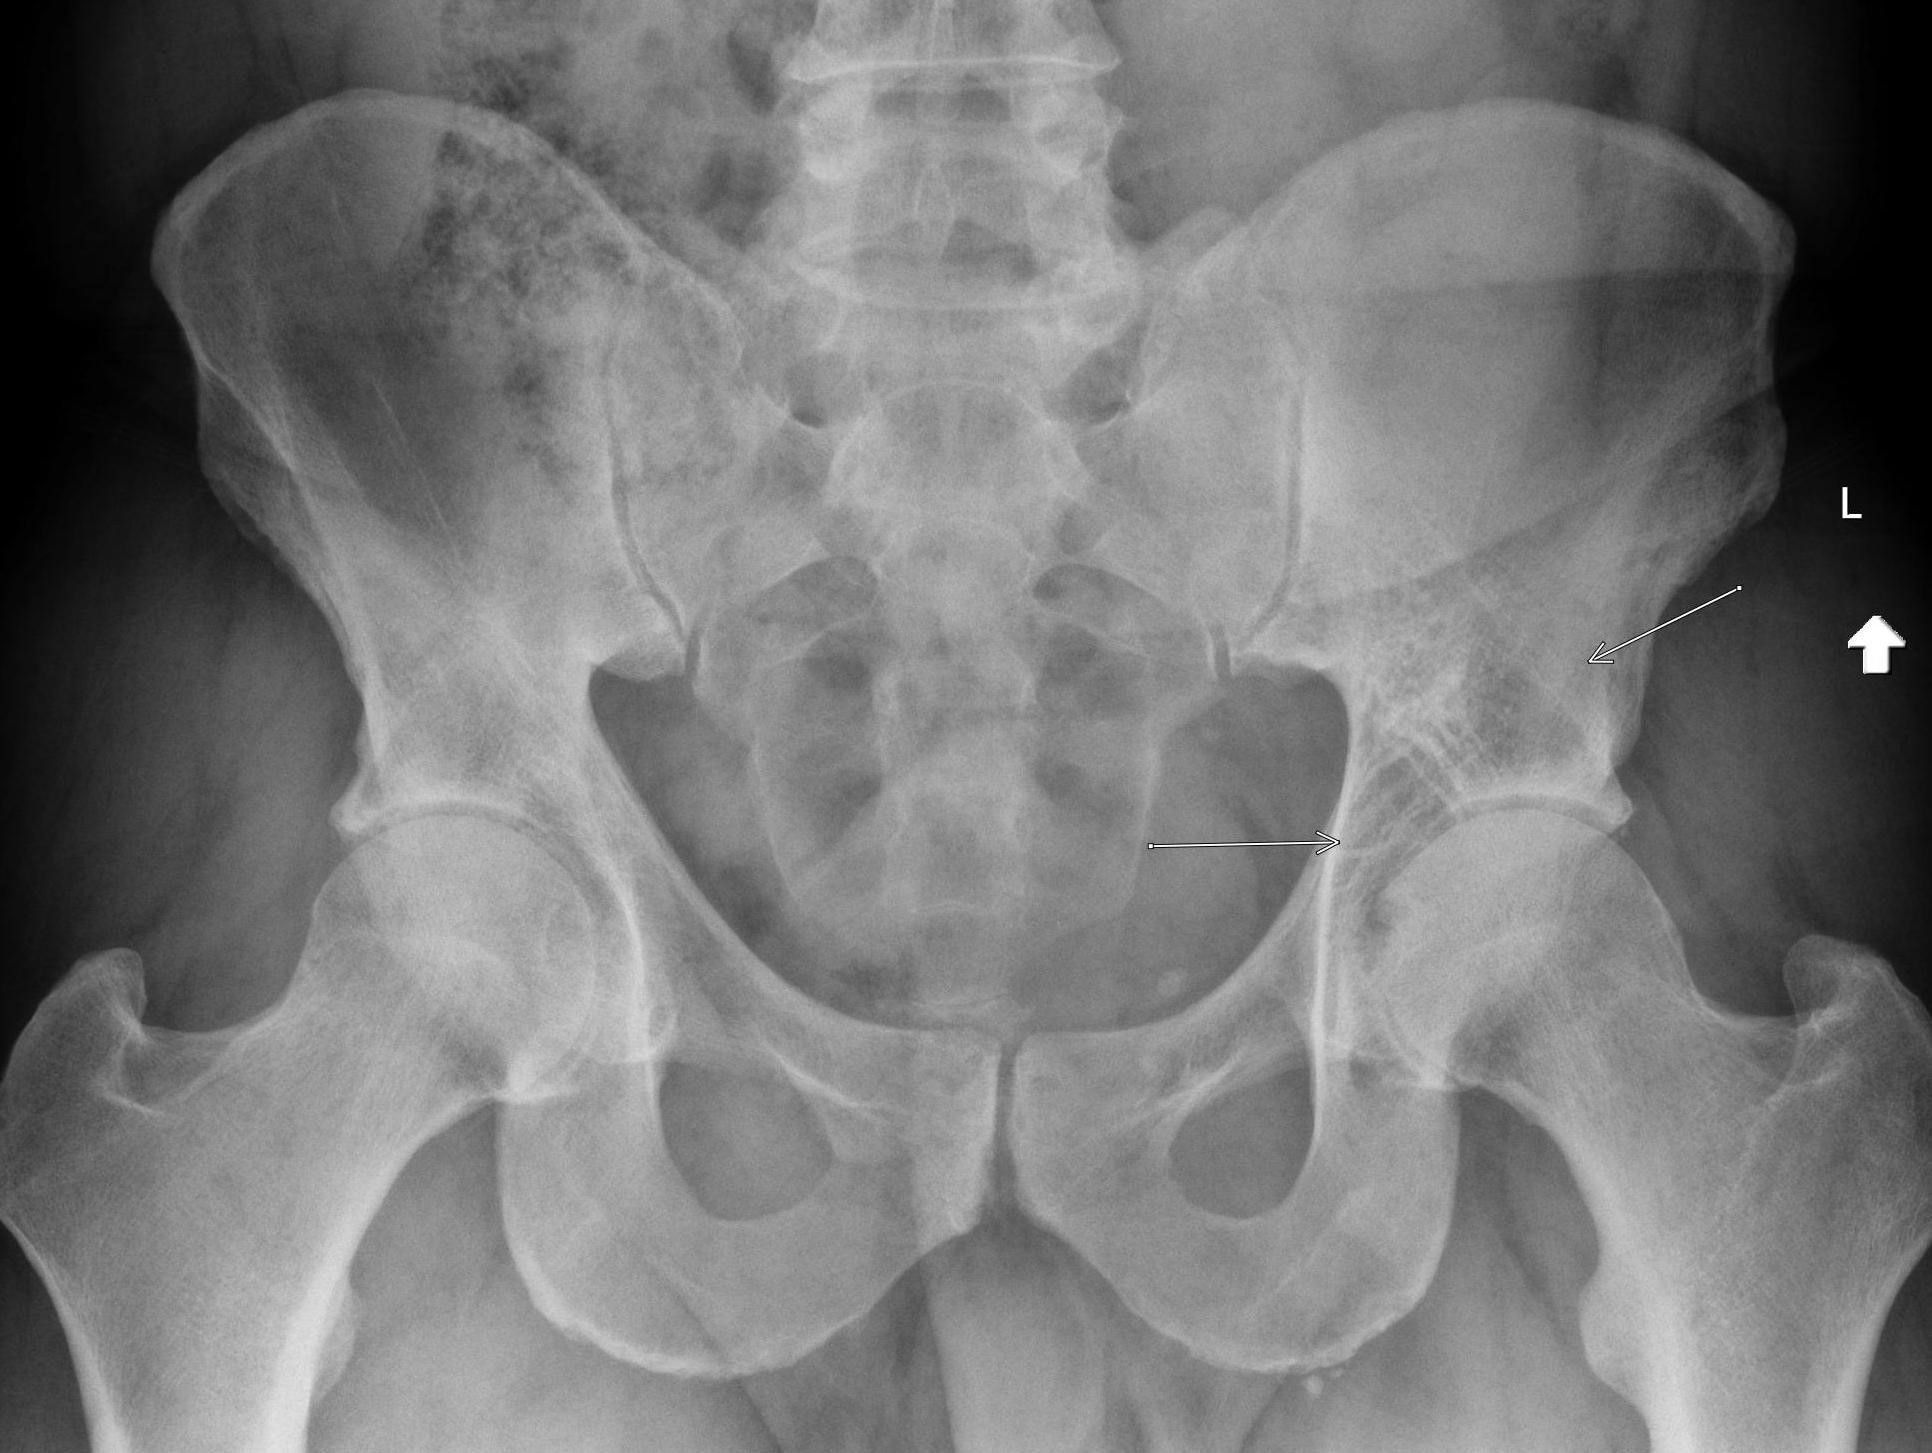
An AP radiograph of the pelvis and hips demonstrates a lucent lesion within the superior acetabulum with thickening of the trabecula. The hip joint spaces are moderately narrowed superiorly.
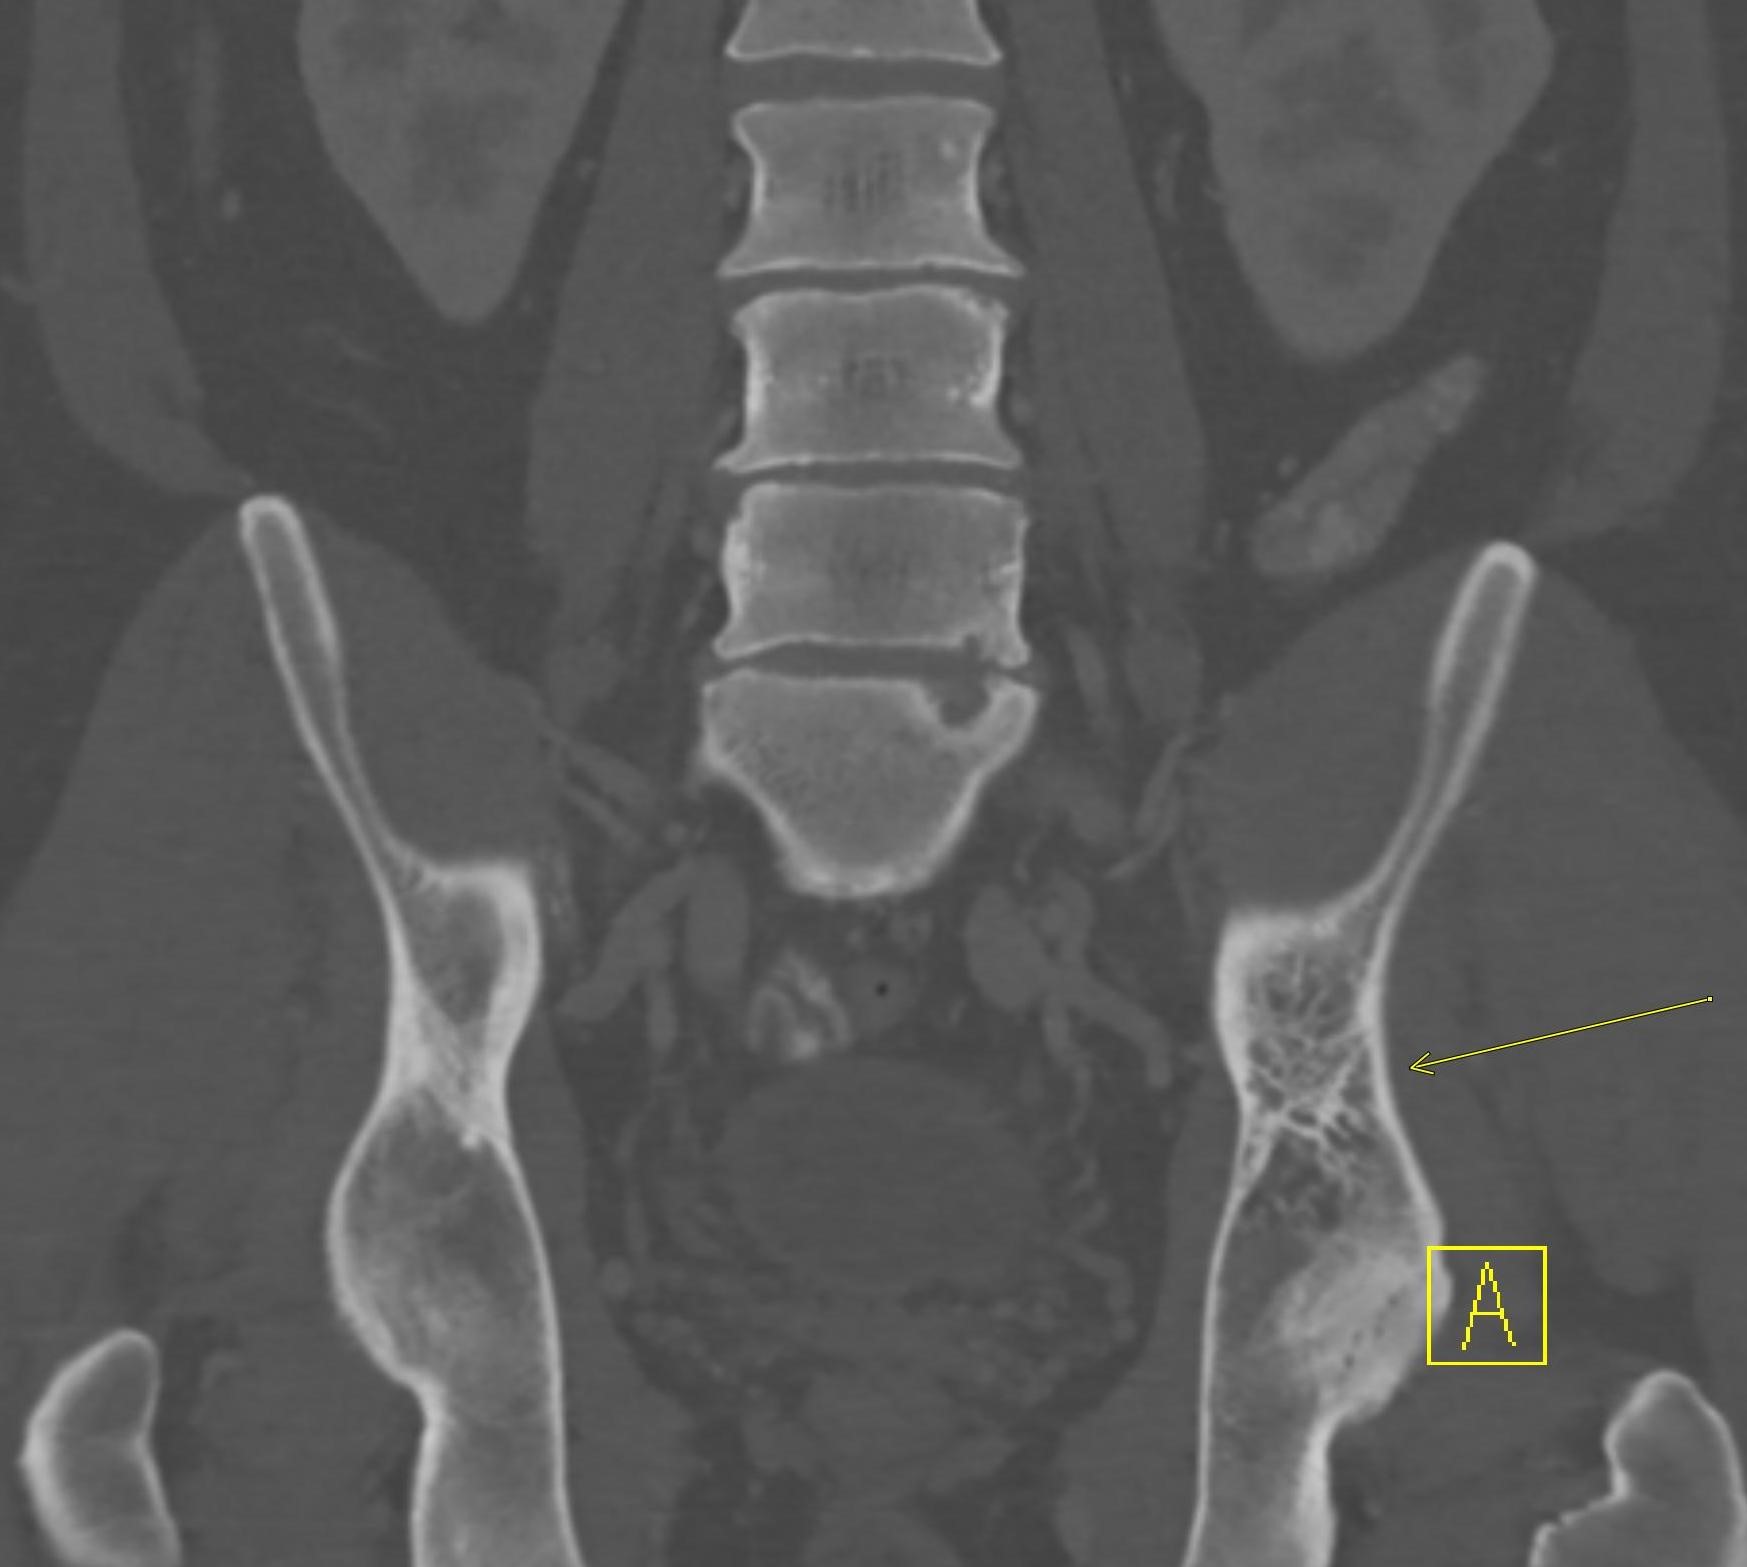
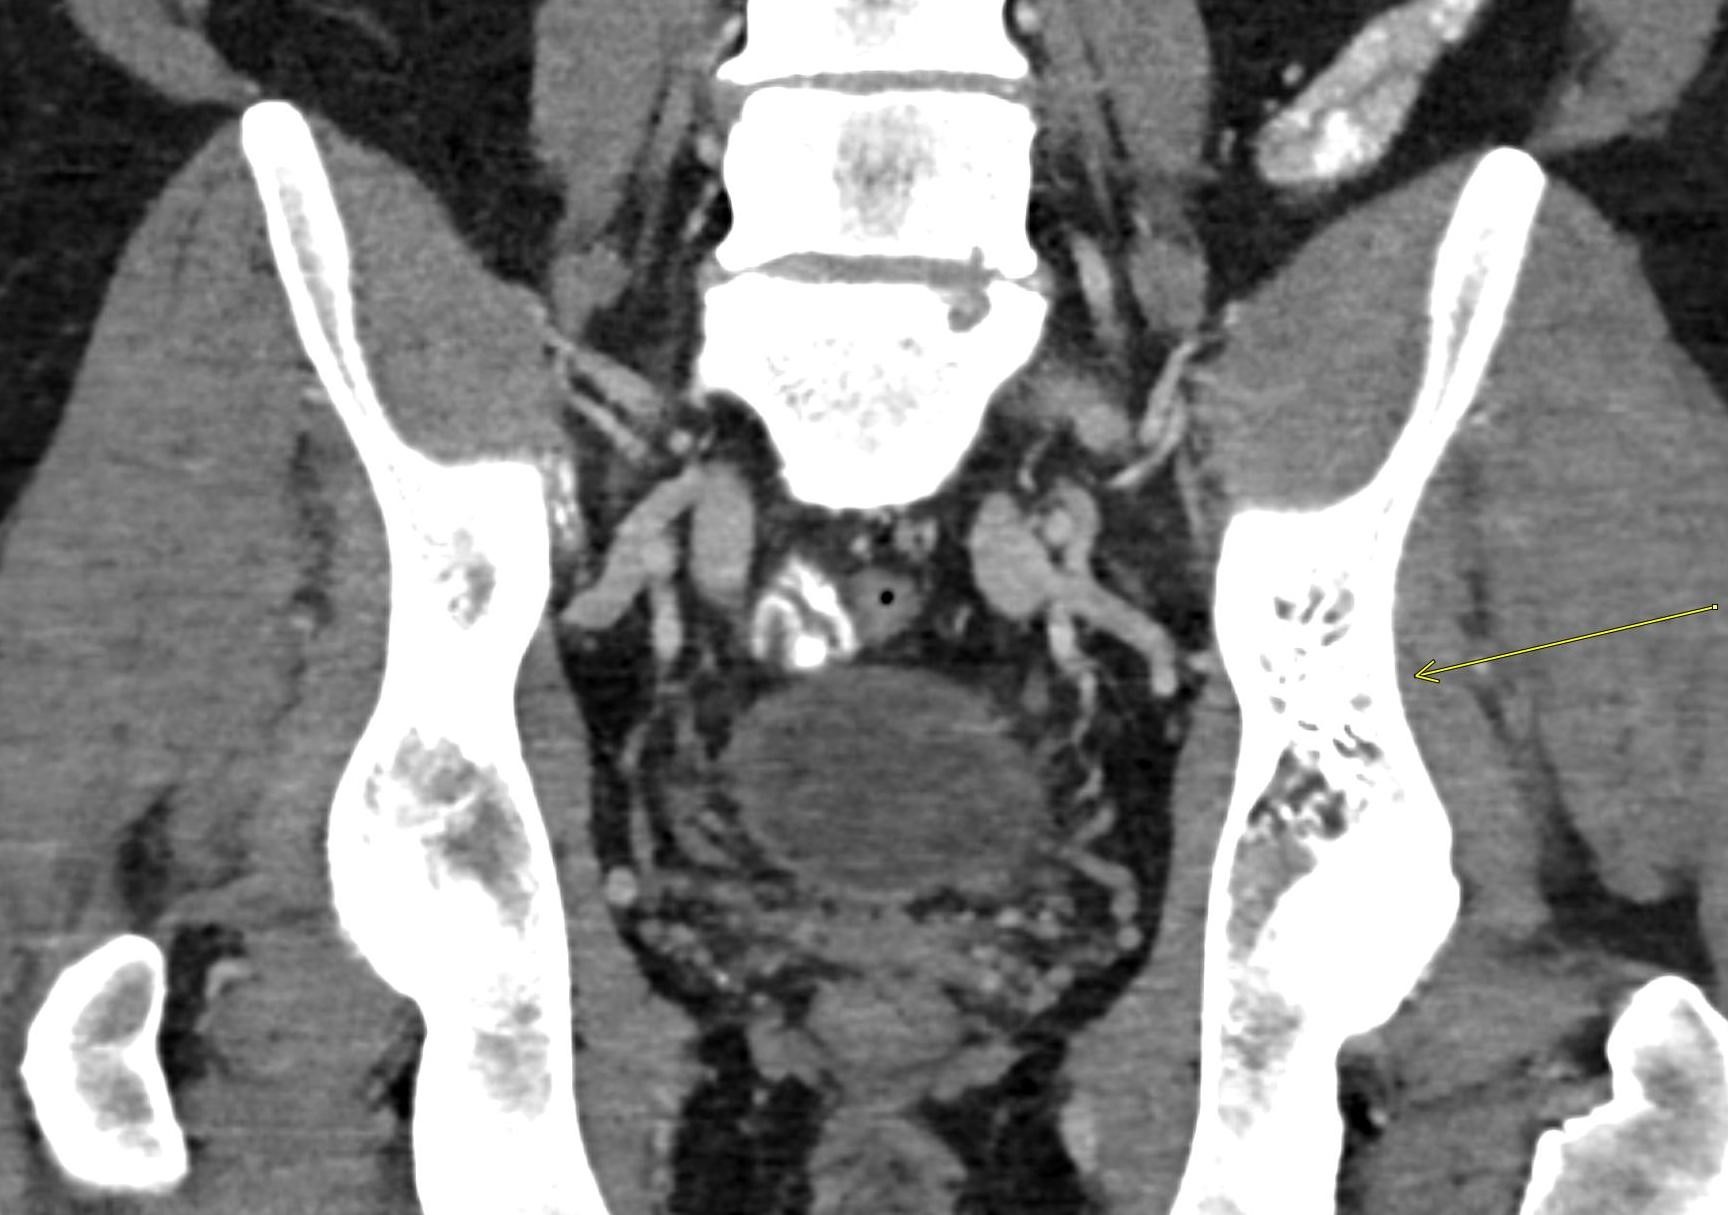
Coronal CT images of the lesion demonstrate a lesion with thickened trabecula on bone windows (top image) and foci of intralesional fat (bottom image; shown as the very dark spots within the lesion). There is no significant cortical thickening or osseous expansion, and the ends of the bones are not involved.
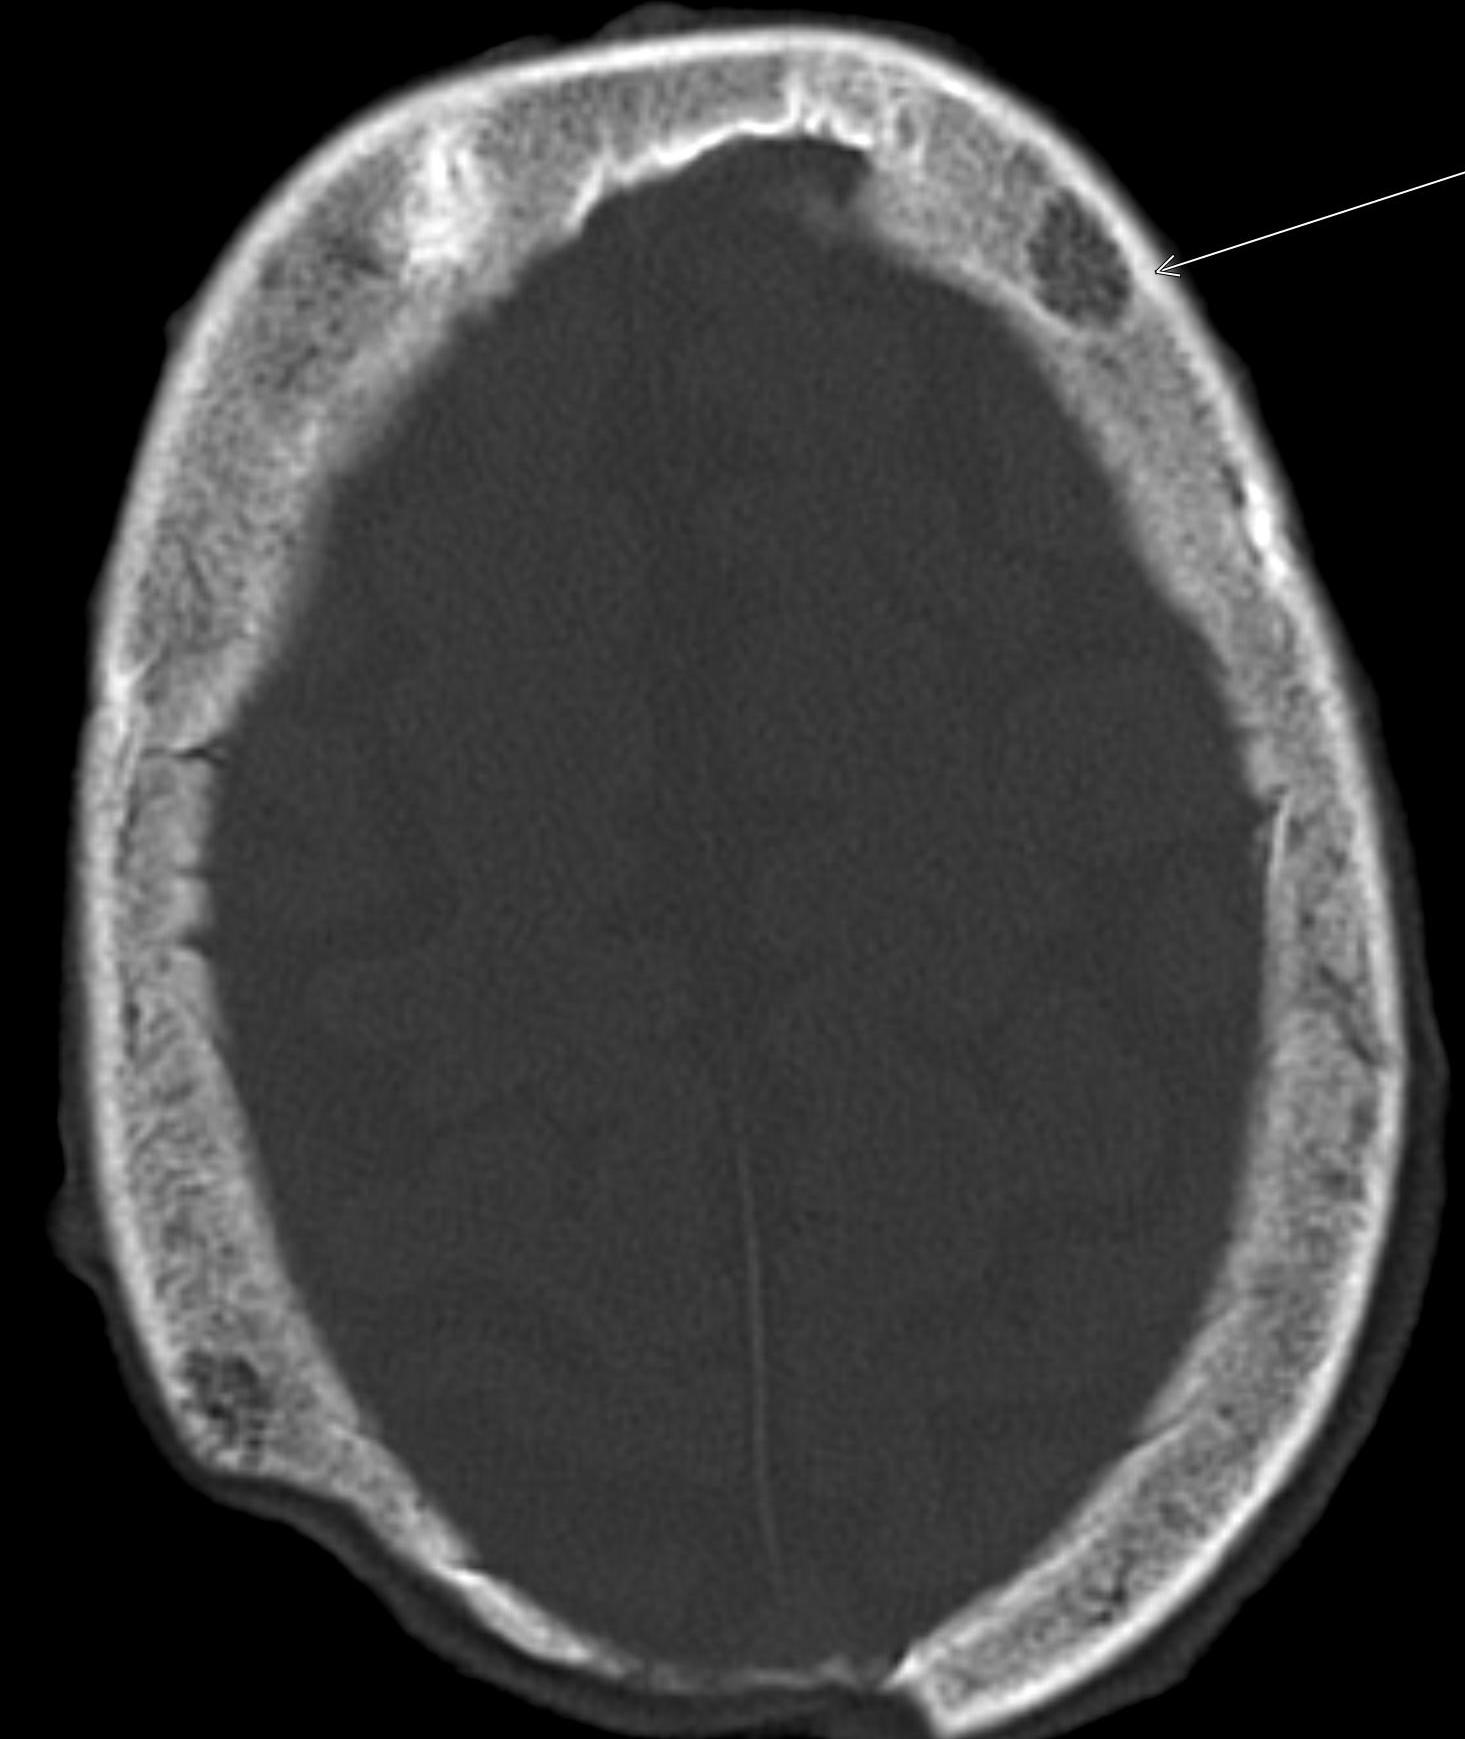
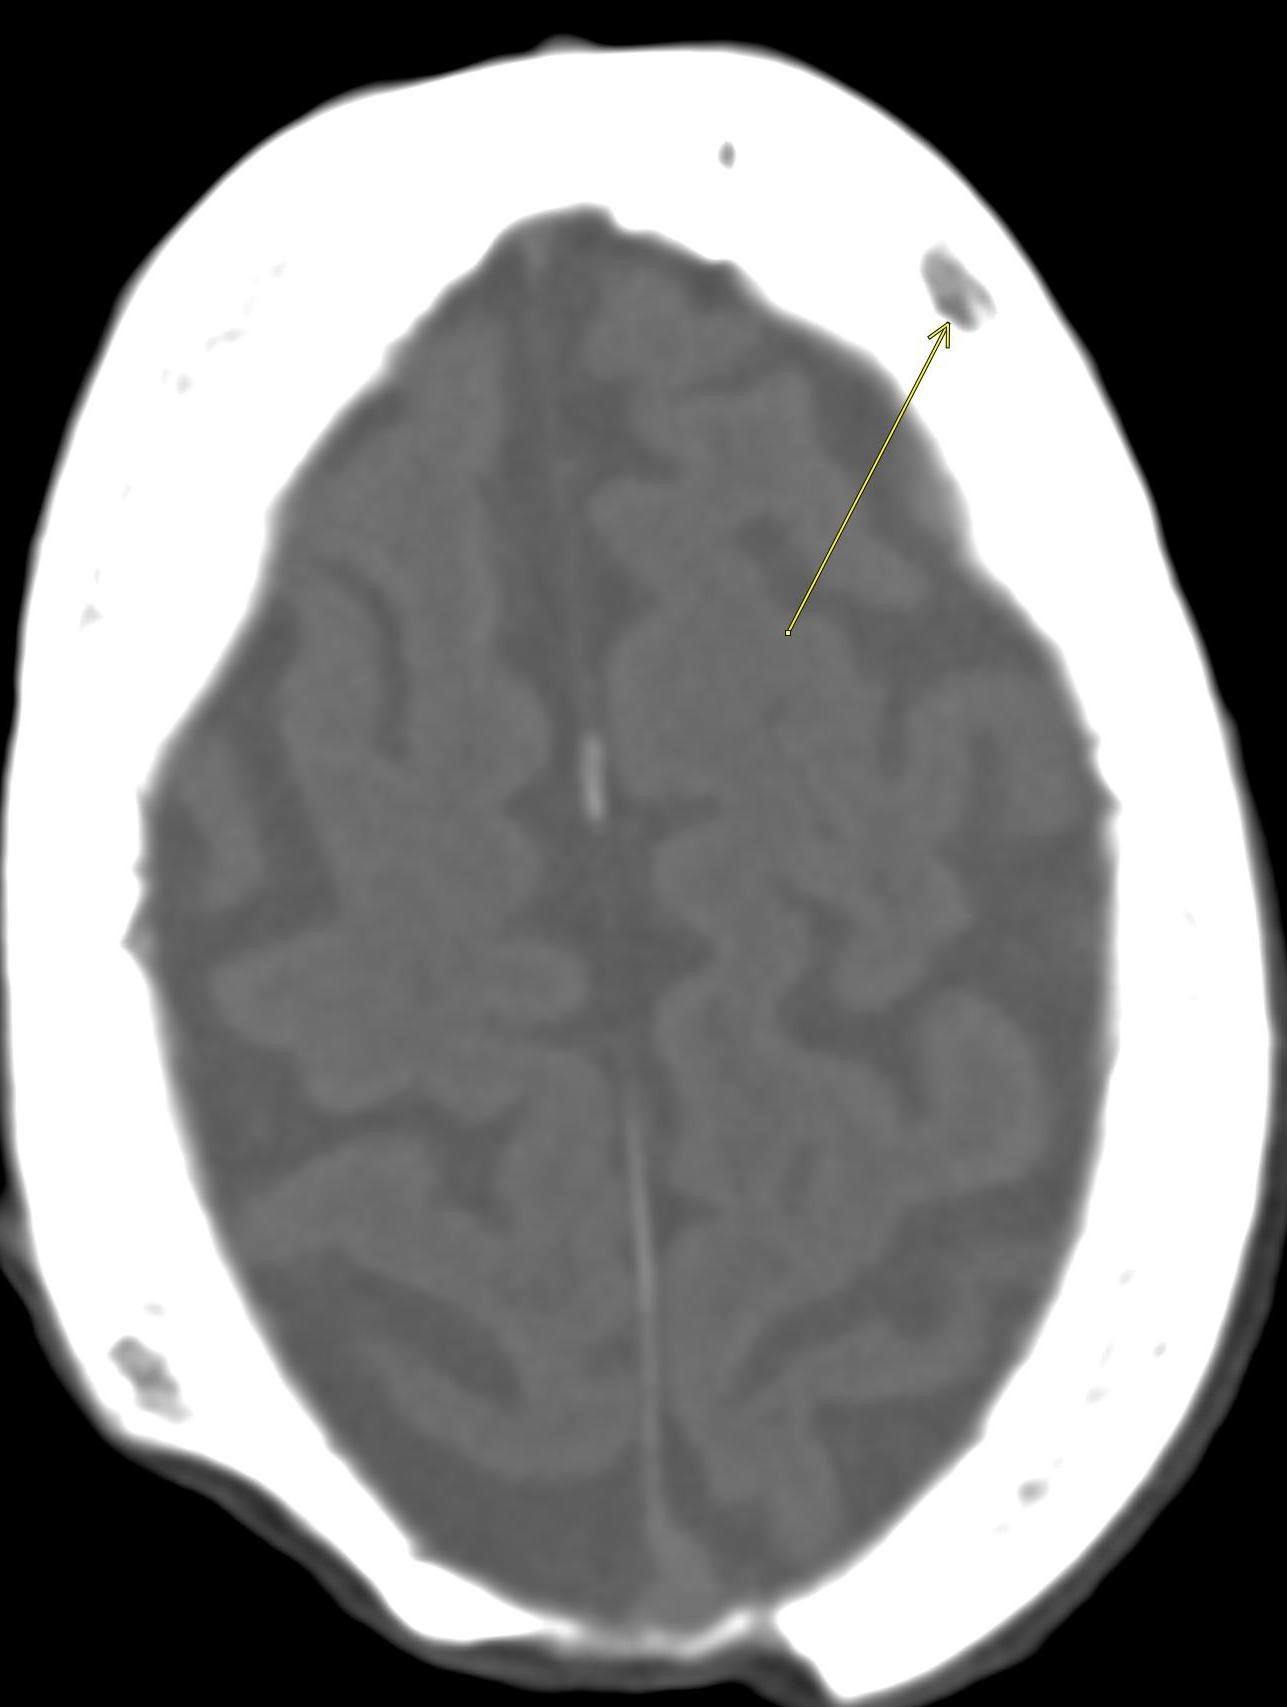
Axial CT images of the calvarium in a separate patient demonstrate a similar-appearing lucent lesion with trabecular thickening. The cortex is not thickened. On soft tissue windows (bottom image), the very dark spot pointed out by the arrow represents a tiny focus of intralesional fat.
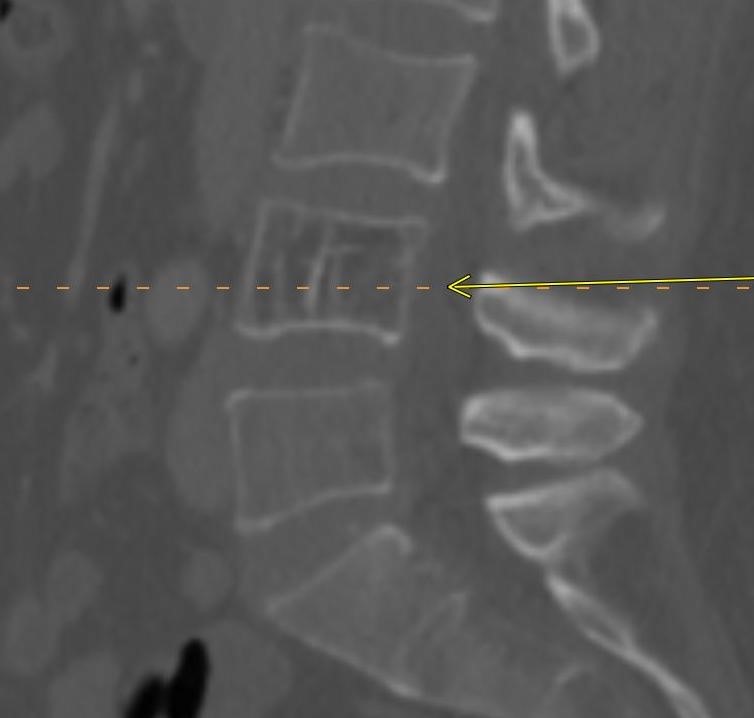
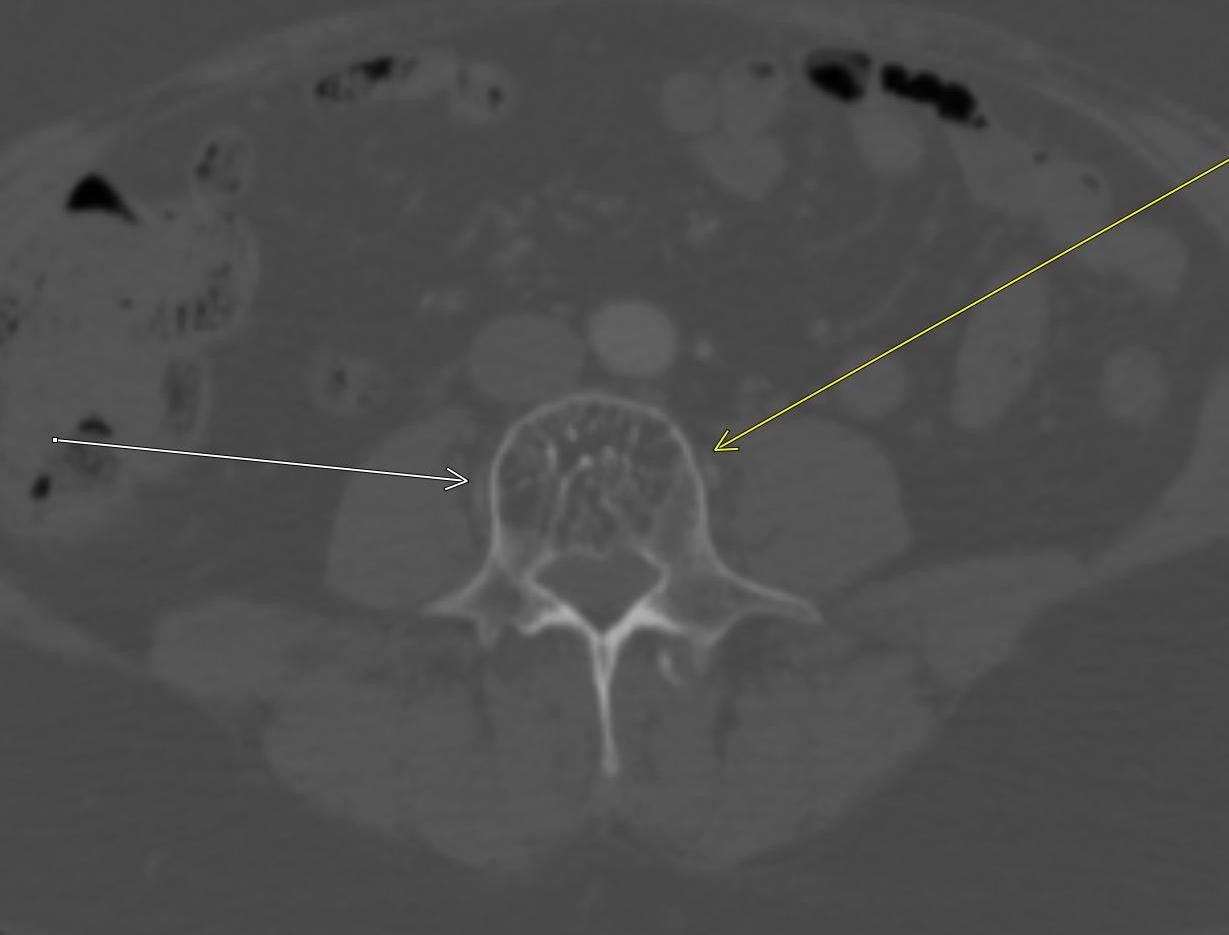
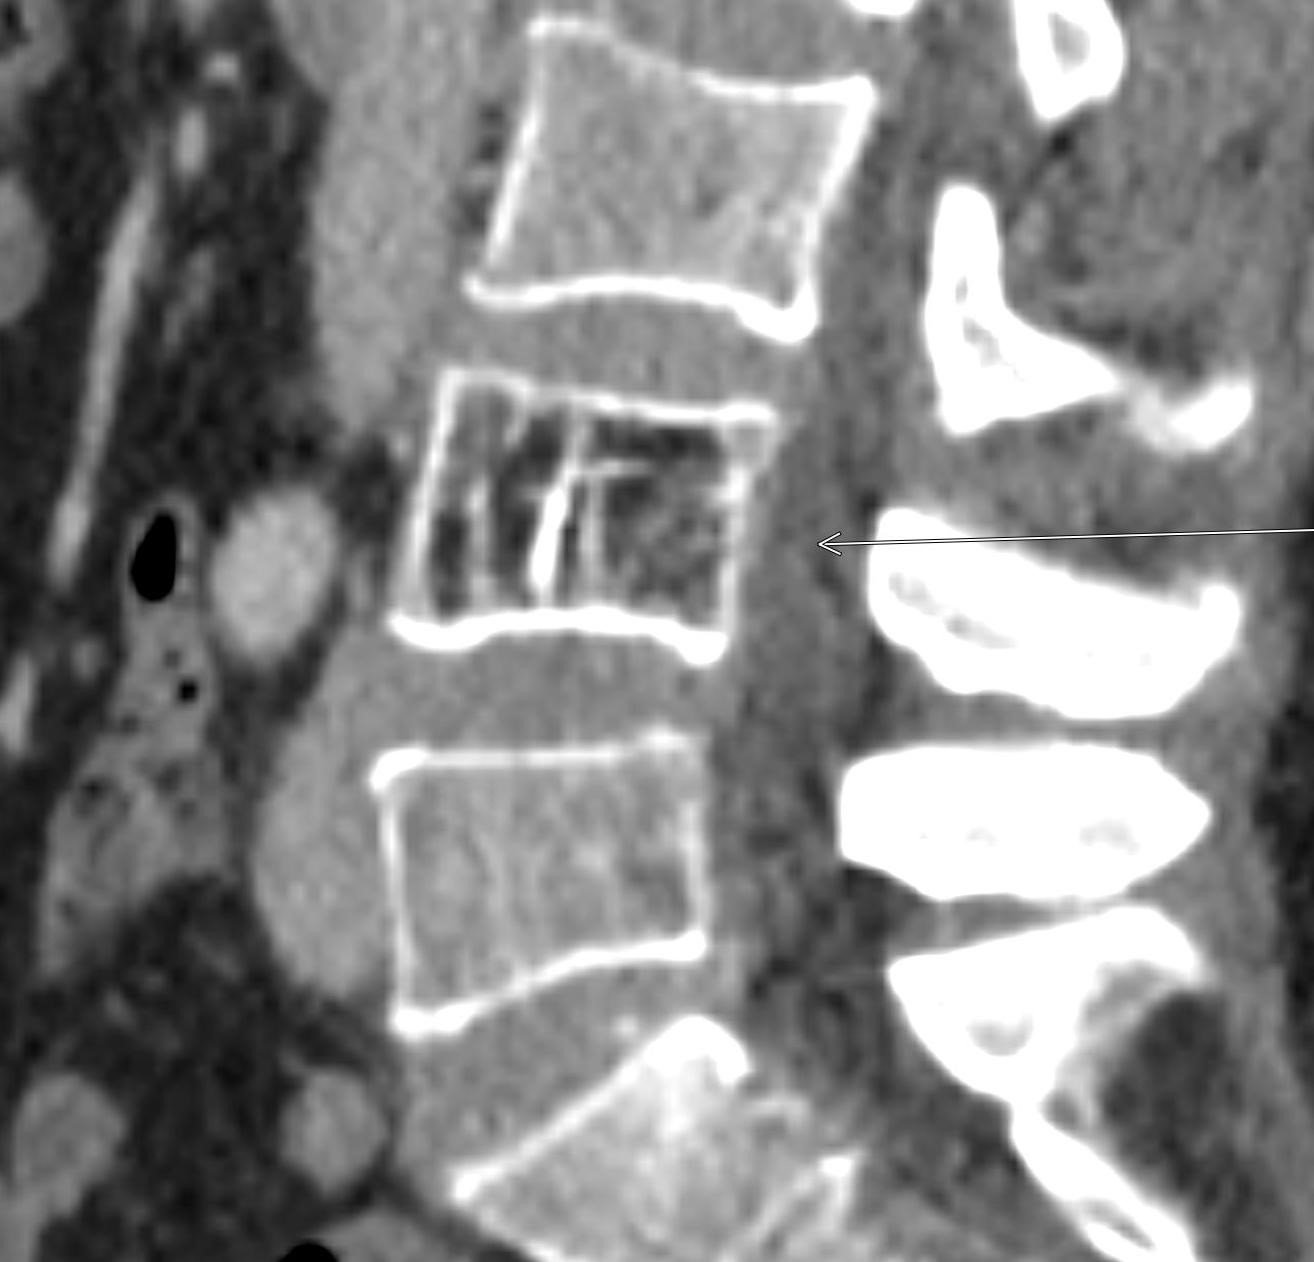
Sagittal and axial CT images of the lumbar spine in a separate patient demonstrate a lucent lesion in the L4 vertebral body with trabecular thickening. On sagittal imaging, the thickened, longitudinal trabecula is described as the “corduroy sign” (1st and 3rd images). On axial images, the thickened trabecular takes on the appearance of the “polka dot sign” (2nd image). Once again, there is no cortical thickening. On soft tissue windows (3rd image), intralesional fat is again seen.
Diagnosis: Intraosseous Hemangiomas in Various Locations
Teaching Points:
Intraosseous hemangiomas are slow-growing vascular malformations. They are benign lesions although in rare instances can be locally aggressive. They are most often seen in the spine and calvarium.
Intraosseous hemangiomas share common imaging features regardless of their location in the body. On radiographs and CT, the hallmark finding is thickened trabecular markings. This is described as the “corduroy sign” on coronal and sagittal images and the “polka dot sign” on axial images. Intralesional fat is also a classic feature, so it is important to look on soft tissue windows for foci of fat-density within the lesion. On MRI, in-and-out of phase imaging can be helpful to look for intralesional fat. Intraosseous hemangiomas often show some degree of post-contrast enhancement.
While these are usually an easy diagnosis to make in the spine due their classic appearance and prevalence, they can be a source of confusion when seen in unusual locations such as the superior acetabulum in the 1st patient shown above. The main differential diagnosis is Paget’s disease given the common imaging feature of trabecular thickening. However, Paget’s disease should demonstrate additional classic imaging features including 1) trabecular thickening, 2) cortical thickening, 3) osseous expansion, and 4) begins at the end of a bone rather than within the center of the bone. Using these 4 criteria in the case of our 1st patient shown above, the lucent lesion in the acetabulum does not demonstrate cortical thickening or osseous expansion and is located within the center of the bone rather than beginning at the end of the bone. Therefore, the imaging features favor intraosseous hemangioma rather than Paget’s disease. Think about intraosseous hemangiomas whenever you see trabecular thickening without these additional features of Paget’s disease!
Given the benignity of these lesions, intraosseous hemangiomas require no treatment in the vast majority of cases.
References:
- Rigopoulou A, Saifuddin A. Intraosseous hemangioma of the appendicular skeleton: imaging features of 15 cases, and a review of the literature. Skeletal Radiology. 2012; 41: 1525-1536.
- Kaleem Z, Kyriakos M, et al. Solitary skeletal hemangioma of the extremities. Skeletal Radiology. 2000; 29(9): 502-513.
- Theodorou D, Theodorou S, et al. Imaging of Paget Disease of Bone and Its Musculoskeletal Complications: Review. American Journal of Roentgenology. 2011; 196: S64-S75.
November 22, 2021: Mazabraud Syndrome
History: A 55-year-old female presented to the Emergency Department with a chief complaint of a palpable lesion in her posterior right thigh.
Findings:

Pelvis and bilateral hip radiographs demonstrate the smooth, homogenous expansion of the bones with endosteal scalloping and cortical thinning. The internal matrix of the bones has a “ground-glass” appearance.


MRI of the right femur demonstrates two well-circumscribed T2/STIR hyperintense masses, the larger of which corresponded to the patient’s palpable area of concern. The largest is located in the inferior gluteus maximus muscle and the smaller is located in the vastus intermedius muscle.
In addition, the visualized femur and pelvic bones demonstrate heterogeneous T2/STIR hyperintensity, enhancement, and osseous expansion.

Post-contrast images demonstrate heterogenous internal septal enhancement of the intramuscular masses.
Diagnosis: Mazabraud Syndrome
Teaching Points:
Mazabraud Syndrome is a rare condition characterized by fibrous dysplasia and intramuscular myxomas. It is predominantly seen in middle-aged females. Patients may be asymptomatic or could present with palpable masses or pathologic fractures.
Fibrous dysplasia is caused by a defect in osteoblastic maturation, which results in bone being replaced by fibrous stroma and immature bone. It primarily affects younger patients (~30 years old) as opposed to Paget’s disease which affects older populations. It is usually an isolated finding but can be associated with syndromes such as Mazabraud syndrome or McCune-Albright syndrome. Fibrous dysplasia is most often monostotic (affecting only one bone) and less often polyostotic (affecting multiple bones). The most common sites involved are the ribs and proximal femur. On radiographs and CT, the bones will demonstrate an internal ground-glass matrix with osseous expansion, endosteal scalloping, and cortical thinning. There may be fusiform enlargement of the ribs or a shepherd crook deformity of the femoral neck. Treatment is most often conservative as patients are usually asymptomatic, although surgery may be required due to pathologic fractures, pain, or compression of adjacent structures due to osseous expansion. Malignant transformation to osteosarcoma, fibrosarcoma, or malignant fibrohistiocytoma can occur in rare cases, usually in the polyostotic form.
Intramuscular myxomas are benign tumors that affect skeletal muscle. They most often occur in the quadriceps, hip adductors, and gluteus muscles. In the setting of Mazabraud Syndrome, they tend to occur in the areas most affected by fibrous dysplasia (typically the pelvis and lower extremities). On imaging, they are well-circumscribed ovoid lesions that are very T2 hyperintense with variable enhancement patterns (peripheral/internal/heterogenous). Treatment is most often conservative given the benign nature of these tumors.
References:
- McLaughlin A, Stalley P, et al. Correlative Imaging in an Atypical Case of Mazabraud Syndrome. American Journal of Roentgenology. 2007; 189: W353-356.
- Gaumetou E, Tomeno B, et al. Mazabraud’s syndrome: A case with multiple myxomas. Orthopaedics and Traumatology: Surgery and Research. 2012; 98(4): 455-460.
- Munksgaard P, Salkus G, et al. Mazabraud’s syndrome: case report and literature review. Acta Radiol Short Rep. 2013; 2(4).
- Kushchayeva Y, Kushchayev S, et al. Fibrous dysplasia for radiologists: beyond ground glass bone matrix. Insights into Imaging. 2018; 9: 1035-1056.
November 15, 2021: Meckel’s Diverticulitis
History: A 30-year-old male presented to the Emergency Department with right lower quadrant pain.


Coronal and axial CT images of the abdomen and pelvis demonstrated a 3 x 2 cm blind-ending pouch in the right lower quadrant arising from the distal ileum that does not fill with oral contrast. There is mild surrounding fat stranding. A normal, non-dilated, air-filled appendix was visualized separately from this structure.
Diagnosis: Meckel’s Diverticulitis
Teaching Points:
Meckel’s diverticulitis is inflammation of a Meckel’s diverticulum. It is a clinical mimic of acute appendicitis as it often presents in young patients with right lower quadrant pain. It is important to keep this entity in your mind as a possible source of right lower quadrant pain when you visualize a normal-appearing appendix. In addition to pain, patients can present with painless rectal bleeding.
A Meckel’s diverticulum is a remnant of the omphalomesenteric-vitelline duct. It follows the “rule of 2’s” meaning that it occurs in 2% of the population, is located within 2 feet of the ileocecal valve, measures approximately 2 inches long, has 2 types of ectopic tissue (gastric and pancreatic), and most often presents within the first 2 years of life.
It is most often diagnosed via ultrasound or CT. Ultrasound will demonstrate an incompressible, blind-ending, hypoechoic tubular structure with irregular margins, very similar in appearance to an appendix. CT will similarly demonstrate a fluid-filled, blind-ending pouch arising from the distal ileum with surrounding inflammatory changes, wall thickening, and mural hyperenhancement. A non-enhancing wall is suggestive of gangrenous Meckel’s diverticulitis. Identification of a normal appendix is necessary to distinguish from acute appendicitis, which has very similar imaging features. A nuclear medicine pertechnetate study can also be obtained to identify the ectopic gastric mucosa, which is often present in bleeding diverticula.
In addition to Meckel’s diverticulitis, other complications of a Meckel’s diverticulum include GI bleed, small bowel obstruction, intussusception, or perforation.
References:
- Elsayes K, et al. Imaging Manifestations of Meckel’s Diverticulum. American Journal of Roentgenology. 2007; 189(1): 81-88.
- Milam R, et al. Meckel Diverticulitis. Radiology. 2017; 283(1).
- Kotha V, et al. Radiologist’s perspective for the Meckel’s diverticulum and its complications. Br J Radiol. 2014; 87(1037).
November 8, 2021: Gastric and Duodenal Bezoars
History: A 30-year-old female with a history of trichotillomania and trichophagia presented to the Emergency Department with abdominal pain, abdominal distention, and vomiting.
Findings:
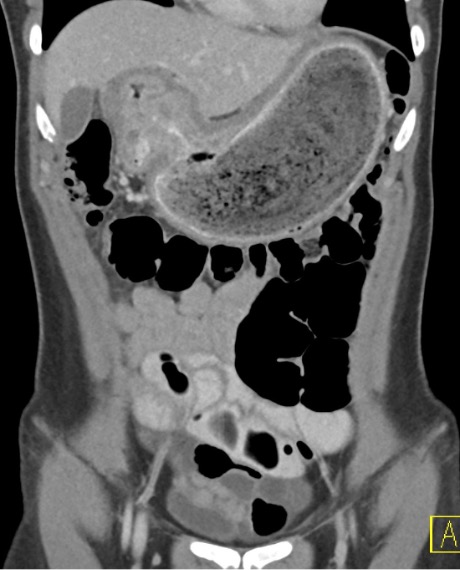
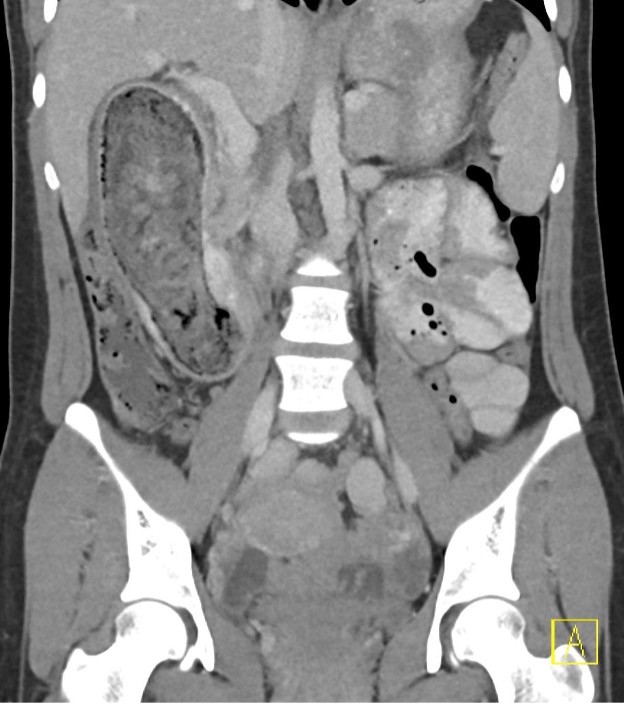
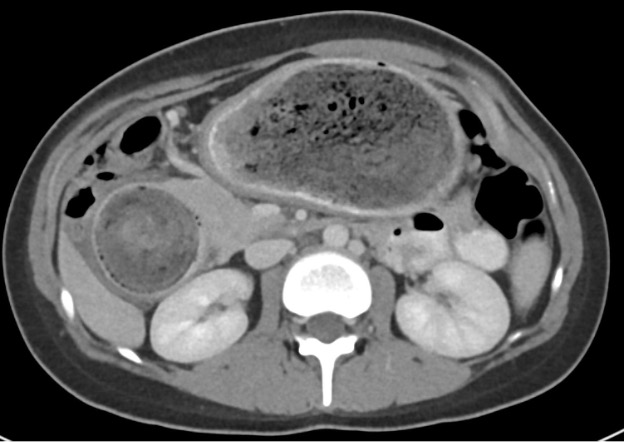
Coronal and axial images of the abdomen demonstrate marked distention of the stomach and proximal duodenum secondary to complex mass-like, well-circumscribed collections of intraluminal debris. The “masses” are mottled in appearance with internal foci of air. There is associated wall thickening of the involved stomach and duodenum.
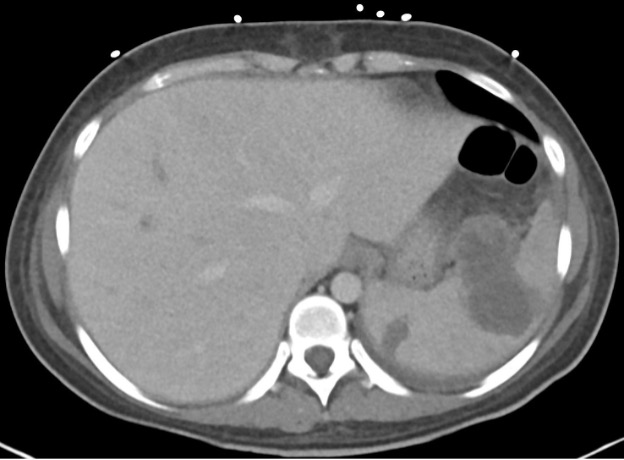
Post-operative images of the abdomen demonstrate soft tissue-stranding in the left upper quadrant with apparent discontinuity of the greater curvature of the stomach near the gastric cardia with a large, complex fluid collection compatible with abscess extending from the stomach into the splenic parenchyma. An additional, smaller abscess is seen more medially with the posterior spleen.
Diagnosis: Gastric and Duodenal Bezoars Causing Gastric Outlet Obstruction
Teaching Points:
A trichobezoar is an intraluminal mass within the gastrointestinal tract formed from ingested hair. Hair is resistant to digestion and accumulates over time to form a hairball, which can result in gastric outlet obstruction or small bowel obstruction (Rapunzel syndrome). Bezoars do not usually pass or resolve spontaneously, so treatment most often requires endoscopic removal, and if not performed in time can result in bowel perforation.
There are multiple types of bezoars, depending on the main component of the mass. While trichobezoars are composed of hair, phytobezoars are composed of indigestible food materials such as vegetable fibers or poorly digested fruit (classically persimmons), pharmacobezoars are composed of undigested medications tablets, and lactobezoars are composed of undigested milk curds.
CT is the imaging modality of choice for diagnosis, which will demonstrate dilatation of the stomach or small bowel loops depending on the level of obstruction. The bezoar will appear as a focal, well-circumscribed, round or oval, mottled mass within the lumen of the bowel. The mottled appearance is secondary to air trapped within the mass. The wall of the stomach should be able to be delineated separately from the wall of the mass in order to distinguish a bezoar from a large amount of retained gastric contents.
Most bezoars occur in patients with a history of gastric surgery or altered gastric motility. However, trichobezoars are found almost exclusively in younger females with trichophagia.
References:
- Ripollés T, García-aguayo J, Martínez MJ et-al. Gastrointestinal bezoars: sonographic and CT characteristics. AJR Am J Roentgenol. 2001;177 (1): 65-9.
- Altintoprak F, et al. CT Findings of Patients with Small Bowel Obstruction due to Bezoar: A Descriptive Study. The Scientific World Journal. 2013.
- Verstandig AG, et al. Small bowel phytobezoars: detection with radiography. Radiology. 1989.
October 18, 2021: Ectopic Pancreatitis
History: A 40-year-old woman presented to the Emergency Department with one week of abdominal pain, nausea, and vomiting. Labs were notable for elevated lipase.
Finding:
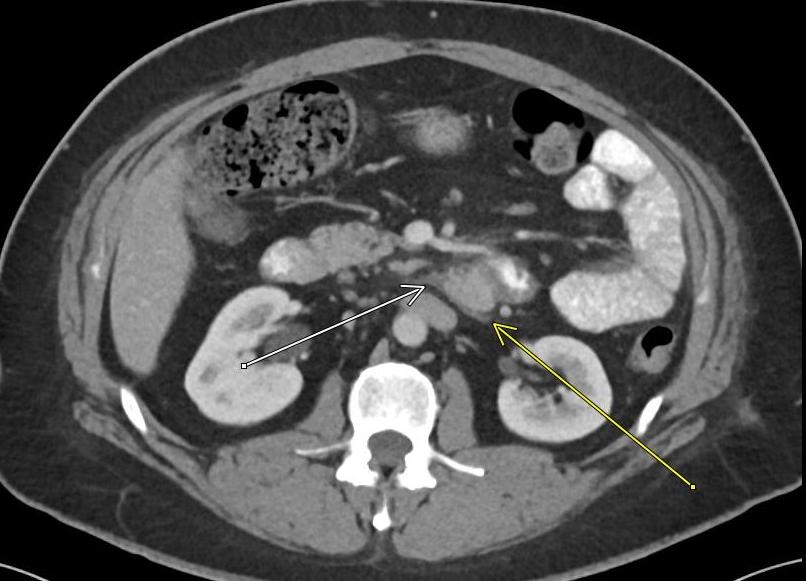
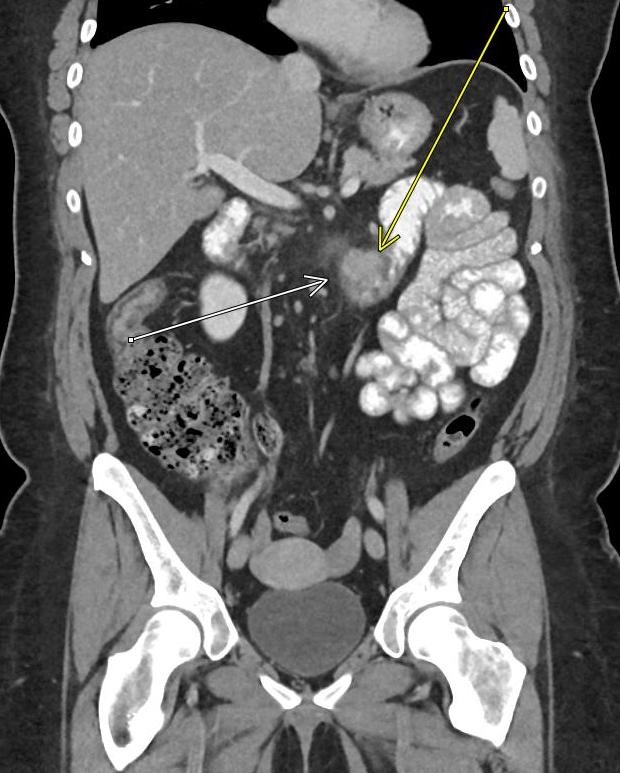
Axial and coronal images from the contrast-enhanced CT of the abdomen and pelvis demonstrated a lobulated focus of soft tissue posterior to the duodenal-jejunal junction. It has the appearance of pancreatic tissue with interdigitating fat and measures approximately 2.5 cm in diameter. There is associated inflammation with surrounding fat stranding and adjacent lymph nodes.
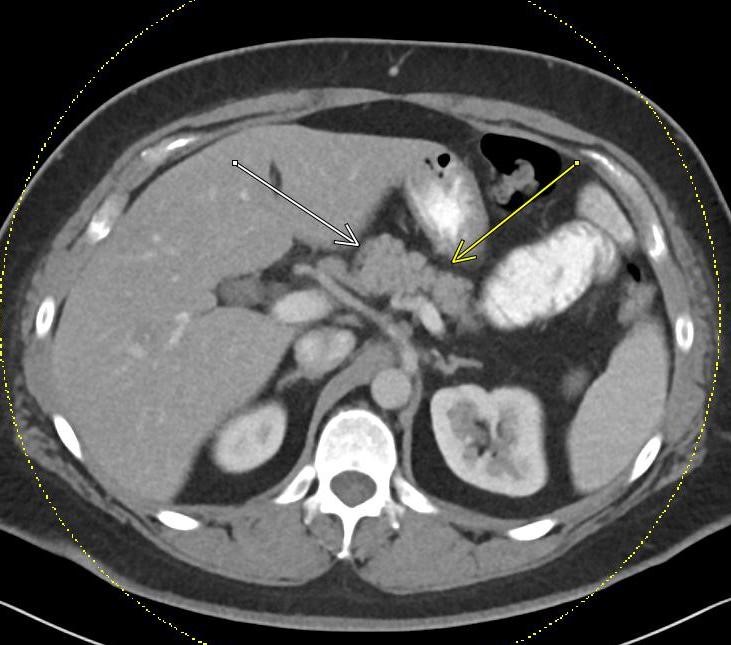
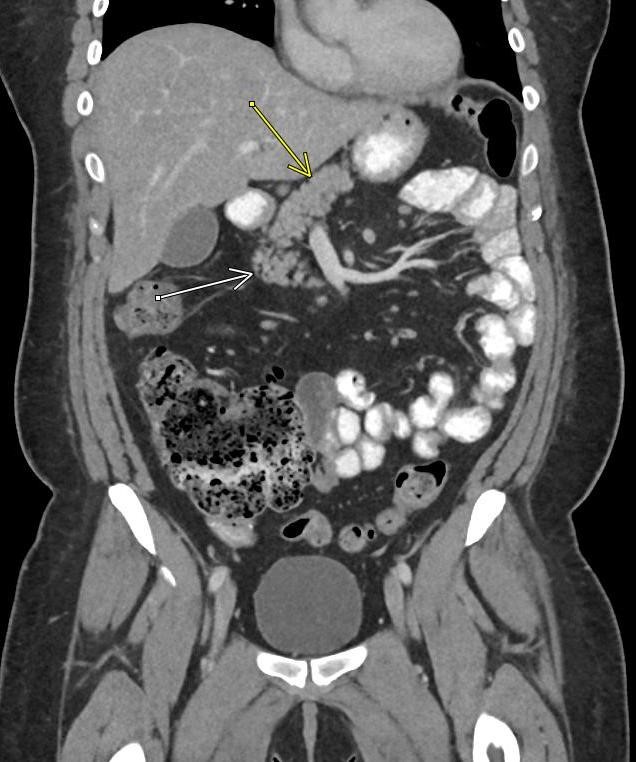
Additional images of the same patient demonstrate that there is normal-appearing pancreatic tissue in the expected location without associated inflammation.
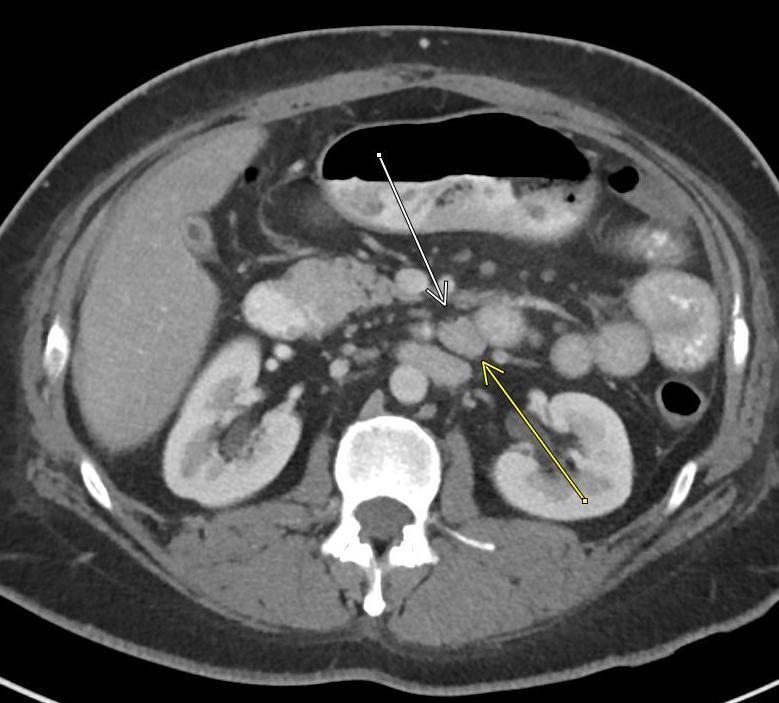
A follow-up CT after treatment of acute pancreatitis demonstrates a persistent soft tissue mass posterior to the duodenal-jejunal junction with a resolution of the adjacent fat stranding. Note that this ectopic pancreatic tissue could easily be mistaken for an enlarged lymph node, bowel, or tumor when there is no surrounding fat stranding.
Diagnosis: Heterotopic pancreas with acute pancreatitis
Teaching Points:
Ectopic/heterotopic pancreatic tissue is defined as pancreatic tissue in the submucosal, muscularis, or subserosal layers of the luminal GI tract. It lacks any ductal or vascular connection with the main pancreatic gland. The most common locations for ectopic pancreas include the proximal duodenum, proximal jejunum, and gastric antrum. Less common sites include the ileum, esophagus, and Meckel’s diverticulum. The cause of the ectopic pancreas is unknown, but it is embryological/developmental in etiology and is thought to be related to deposits of pancreatic tissue being “dropped” into the developing GI tract.
It is most commonly asymptomatic but can demonstrate any pathology that can be seen in the normal pancreas including pancreatitis or pancreatic tumors. Most lesions are solitary and measure less than 3 cm.
There are multiple histologic subtypes of ectopic pancreatic tissue. Type 1 heterotopic tissue contains acini, ducts, and islet cells similar to normal pancreatic tissue. Type 2 contains only acini and ducts and Type 3 contains only ducts.
On fluoroscopic barium studies, ectopic pancreatic tissue has the appearance of an extramucosal intramural lesion with a broad base and smooth surface, and often contains a central barium-filled pit or umbilication.
On CT, the characteristic location, endoluminal growth pattern, microlobulated borders, and prominent enhancement of the overlying mucosa help to differentiate the ectopic pancreas from other tumors.
On MRI, the heterotopic pancreatic tissue will have similar signal characteristics as the main pancreatic gland with a characteristic high intrinsic T1 signal.
References:
- Resvani M, et al. Heterotopic Pancreas: Histopathologic Features, Imaging Findings, and Complications. 2017; 37(2).
- Kim JY, et al. Ectopic Pancreas: CT Findings with Emphasis on Differentiation from Small Gastrointestinal Stromal Tumor and Leiomyoma. Radiology. 2009; 252(1).
Subramanian M, et al. Clinics in diagnostic imaging: duodenal ectopic pancreas. Singapore Medical Journal. 2014; 55(12): 629-634.
Week of October 04, 2021: Oreo Cookie Sign of a Pericardial Effusion
History: 70-year-old male with a history of cardiac amyloidosis who presented to the Emergency Department with shortness of breath.
Findings:

The PA chest radiograph demonstrates an enlarged cardiac silhouette. The cardiothoracic ratio is a measurement obtained on PA chest radiographs and is defined as the ratio of maximal horizontal cardiac diameter (top line) to maximal horizontal thoracic diameter measured from inner rib to inner rib (bottom line). When this ratio measures greater than 0.5, the cardiac silhouette is considered enlarged. This could be related to cardiomegaly or pericardial effusion. Prominent epicardial fat pads can also sometimes lead to this ratio measuring enlarged when there is no true pathology involving the heart or pericardium.

The lateral chest radiograph of the same patient demonstrates the “Oreo Cookie” sign. This sign describes two vertical linear lucent lines (yellow arrows) separated by an opaque line (green arrow) on the lateral chest x-ray. The most anterior lucent line (directly posterior to the sternum) represents paracardial fat and the most posterior lucent line represents epicardial fat. In between these two fat layers is the opaque line (green arrow), which represents pericardial fluid. When this sign is seen on a chest x-ray, it is highly suggestive of pericardial effusion.

A sagittal view from a PET/CT on the same patient confirms the presence of pericardial effusion. The two yellow arrows in the picture correspond to the two vertical lucent lines on the chest radiograph and are seen to represent paracardial fat and epicardial fat. The green arrow shows the moderate-sized pericardial effusion between the two fat layers, which corresponds to the opaque vertical line on the chest radiograph.

A sagittal view from a cardiac MRI in the same patient shows similar findings, again confirming the presence of pericardial effusion as suggested on the chest radiograph.
Diagnosis: “Oreo Cookie” Sign of Pericardial Effusion"
Teaching Points:
Pericardial effusions are collections of excess fluid within the pericardial space. There are numerous etiologies for pericardial effusions, including idiopathic, uremia, malignancy, infection, systemic lupus erythematosus, rheumatoid arthritis, post-myocardial infarction (Dressler syndrome), traumatic, and pulmonary arterial hypertension, among many other causes.
In order for pericardial effusions to be visible on the chest radiograph, over 200 mL of fluid must be present. On the PA view, the cardiac silhouette will be globally enlarged and often takes on a “water bottle” configuration. The cardiothoracic ratio described above will be greater than 0.5. The “oreo cookie” sign described above can be seen on the lateral radiograph.
If there are signs suggestive of pericardial effusion on chest radiograph, further evaluation with echocardiography should be recommended.
Symptoms from a pericardial effusion are related to the speed of fluid accumulation rather than the absolute volume. If the fluid accumulates gradually, the pericardium can stretch and accommodate larger volumes. However, if the fluid accumulates rapidly, even a small amount of fluid can impair cardiac function and potentially lead to cardiac tamponade. Echocardiography is the most reliable method to assess the hemodynamic impact of the effusion.
Treatment is most often conservative, but if the patient is symptomatic and there is evidence of hemodynamic compromise, then a pericardiocentesis can be performed for drainage.
References:
- Chiarenza A, et al. Chest imaging using signs, symbols, and naturalistic images: a practical guide for radiologists and non-radiologists. Insights into Imaging. 2019;10(114).
- Wang ZJ, Reddy GP, et al. CT and MR imaging of pericardial disease. 2003;23: S167-180.
- Weissman NJ, Adelmann GA. Cardiac imaging secrets. Elsevier Health Sciences. (2004) ISBN: 1560535156.
Week of September 13 , 2021: Emphysematous Pyelonephritis
History: A 70-year-old female patient with a history of diabetes was admitted after a fall with a left femoral fracture and developed sepsis with leukocytosis and bacteremia while an inpatient.
Findings:


Ultrasound images of the left kidney demonstrate an avascular, echogenic region in the lower pole of the left kidney with associated “dirty” posterior acoustic shadowing. Further evaluation with cross-sectional imaging was recommended.


CT abdomen and pelvis demonstrate foci of air within the renal parenchyma of the lower pole of the left kidney, corresponding to the ultrasound findings. No air was visualized within the collecting system.
Diagnosis: Emphysematous pyelonephritis
Teaching Points:
Emphysematous pyelonephritis refers to an infection of the kidneys with gas-forming organisms such as Escherichia coli, Klebsiella pneumonia, or Proteus mirabilis.
Patients with emphysematous pyelonephritis present with fever, sepsis, and flank pain. Diabetes is the main risk factor, with over 90% of patients having uncontrolled diabetes. Less common risk factors include immunosuppression or collecting system obstruction related to stones or neoplasm.
On ultrasound, emphysematous pyelonephritis appears as coarse echoes within the renal parenchyma with associated “dirty shadowing” or ring-down artifact, consistent with air. CT is the imaging modality of choice for diagnosis and will show enlarged renal parenchyma with bubbly or linear foci of air within the renal parenchyma. Collections of gas can also be seen within Gerota’s fascia. There may be associated fluid collections with gas-fluid levels or abscesses.
Two types of emphysematous pyelonephritis have been described. In Type 1, there are streaky or mottled areas of gas that involve greater than 1/3 of the renal parenchyma without associated intrarenal or extrarenal fluid collections. In Type 2, there are bubbly areas of gas that involve less than 1/3 of the renal parenchyma, more often associated with renal or extrarenal fluid collections. Type 1 has a more fulminant course with a mortality rate approaching 70%, compared to less than 20% for Type 2.
Emphysematous pyelonephritis has a high morbidity and mortality rate. Severe cases are treated with nephrectomy, while mild cases may be treated with IV antibiotics. Without early treatment, it can progress to fulminant sepsis.
Differential considerations include emphysematous pyelitis, which is also secondary to infection but in which the air is limited to the collecting system rather than involving the renal parenchyma. It has a much better prognosis compared to emphysematous pyelonephritis. It is also important to consider an iatrogenic etiology for air within the collecting system or renal parenchyma, as ureteral instrumentation or recent procedure can sometimes result in this appearance in the absence of infection.
References:
- Craig WD, Wagner BJ, Travis MD. Pyelonephritis: Radiologic-Pathologic Review. 2008;28(1): 255-276.
- Wan YL, Lee TY, et al. Acute gas-producing bacterial renal infection: correlation between imaging findings and clinical outcome. 1996;198(2):433-438.
September 07, 2021: Epiploic Appendagitis
History: A 50-year-old woman presented to the Emergency Room with acute left lower quadrant abdominal pain.
Findings:


Axial, coronal, and sagittal views of the contrast-enhanced CT abdomen and pelvis demonstrate two adjacent ovoid-shaped, fat-density structures located anterior to the descending/proximal sigmoid colon. These structures demonstrate thin enhancing rims and significant surrounding inflammatory fat stranding. A central hyperdense “dot” is seen within the center of these structures.
Diagnosis: Epiploic appendagitis
Teaching Points: Epiploic appendagitis is a self-limiting inflammatory process involving an appendix epiploica of the colon. There are approximately 50-100 appendices epiploicae located along the colon, the majority of which are located in the region of the rectosigmoid colon. These appendages are peritoneal pouches arising from the serosal surface of the colon and are attached to the colon via a vascular stalk. Epiploic appendagitis results when there is torsion or spontaneous thrombosis of the venous outflow to one or more of these appendices epiploicae.
Patients with epiploic appendagitis present with acute abdominal pain, which can often mimic diverticulitis or appendicitis. There is a predilection for middle-aged women and obese patients.
On CT, epiploic appendagitis will appear as a fat-density, ovoid structure adjacent to the colon, most often along the anterior aspect of the sigmoid or descending colon. They tend to have thin, hyperdense rims and surrounding inflammatory fat stranding. Sometimes, a “central dot sign” can be seen (as in our case shown above), in which the thrombosed vascular pedicle appears as a punctate hyperdense dot within the fat-density structure. Epiploic appendages are typically visible on CT only when they are inflamed. There is usually no significant wall thickening of the adjacent bowel. In its chronic stage, the infarcted epiploic appendage can calcify and detach from the colon wall, forming an intraperitoneal loose body.
Epiploic appendagitis is self-limiting and usually responds well to NSAIDs. Surgery is not necessary. Symptoms resolve within 2 weeks for most patients, although CT findings can persist for several months.
The main differential consideration is an omental infarct. Still, these are more often located adjacent to the cecum or ascending colon and are typically larger (greater than 3 cm, as opposed to epiploic appendagitis, which more often measures 1.5-3 cm). Omental infarcts also lack the hyperdense rim seen with epiploic appendagitis.
References:
- Singh AK, et al. Acute Epiploic Appendagitis and Its Mimics. 2005; 25(6): 1521-1534.
- Nadida D, et al. Acute epiploic appendagitis: radiologic and clinical features in 12 patients. Int J Surg Case Rep. 2016;28: 219-222.
- Giambelluca D, et al. CT imaging findings of epiploic appendagitis: an unusual cause of abdominal pain. Insights Imaging. 2019;10:26.
September 01 , 2021: Area Postrema Syndrome
History: 30-year-old male with a history of neuromyelitis optica presented to the Emergency Department with intractable hiccups for 3 weeks, with associated intermittent nausea and vomiting.
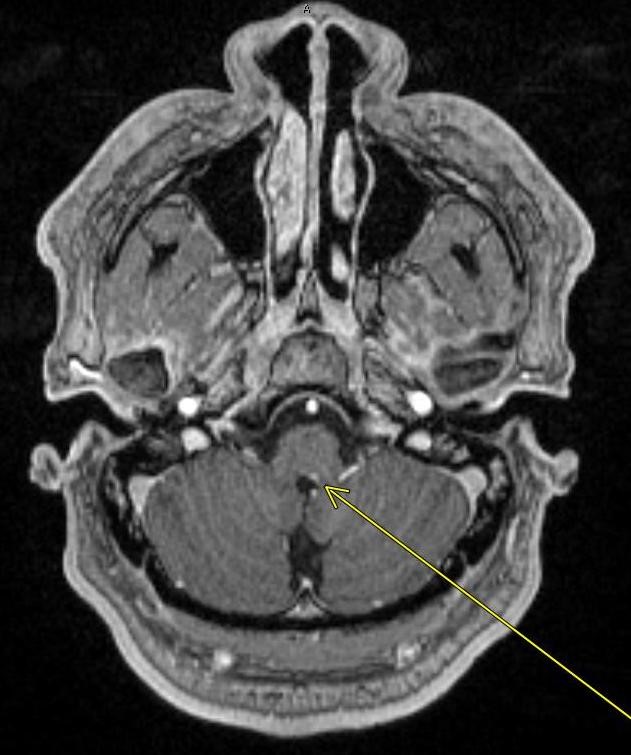
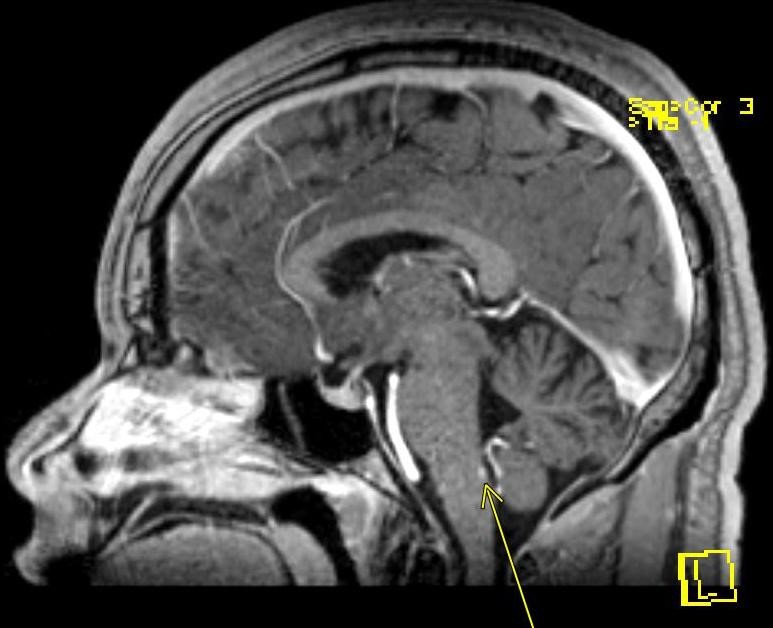
Post-contrast axial and sagittal MRI images of the brain shown above demonstrate a 3 mm focus of enhancement in the left dorsal aspect of the medulla in the region of the area postrema.
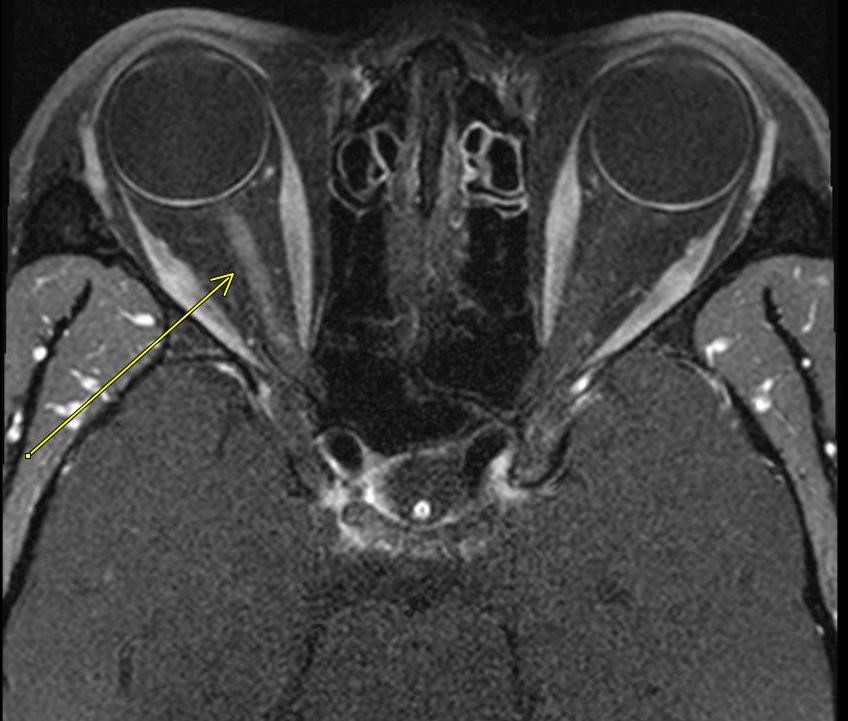
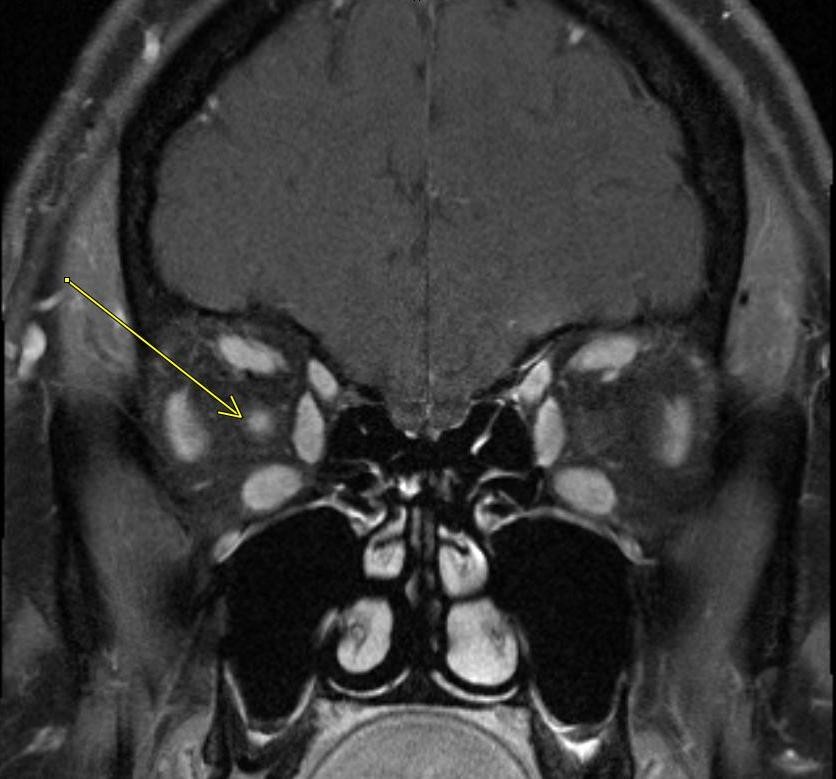
Post-contrast axial and coronal MRI images through the orbits demonstrate enhancement of the right optic nerve. Note the normal left optic nerve without enhancement.
Diagnosis: Neuromyelitis Optica with Area Postrema Syndrome and Optic Neuritis
Teaching Points:
Neuromyelitis Optica spectrum disorders (NMOSD) are a group of inflammatory, autoimmune, demyelinating diseases. The majority are associated with a pathologic antibody specific for the aquaporin-4 (AQP4) water channel. In fact, the clinical diagnosis of NMOSD requires a positive AQP4-IgG and 1 core clinical characteristic, or 2 core clinical characteristics without the AQP4 antibody. Core clinical characteristics of NMOSD include optic neuritis, transverse myelitis, area postrema syndrome, acute brainstem syndrome, and symptomatic narcolepsy.
Brain lesions in NMOSD tend to occur in areas rich in AQP4. One of these areas is known as the area postrema, as seen in the top 2 pictures shown above. The area postrema is located in the dorsal tegmentum of the medulla at the floor of the 4th ventricle and acts as an emetic reflex center and mediates hiccups due to its extensive network of chemo-sensitive neurons and connections with the hypothalamus, brainstem, and bloodstream. Lesions in the dorsal medulla cause inflammation in this area and loss of AQP4 reactivity and therefore result in attacks of intractable nausea, vomiting, and hiccups lasting longer than 48 hours, known as Area Postrema Syndrome. It is estimated that 30% of patients with NMOSD will have Area Postrema Syndrome during the course of their illness. Symptomatic therapies such as antiemetics are typically ineffective, but steroids or plasmapheresis tend to result in rapid cessation of symptoms.
The main imaging feature of area postrema syndrome is an abnormal enhancement of the dorsal medulla in the correct clinical setting. An abnormal FLAIR signal in this region can also be seen.
Additional typical areas of brain involvement in NMOSD at sites of AQP4 include the periependymal surface of the corpus callosum, hypothalamus, periaqueductal area, lateral ventricles, third ventricle, fourth ventricle, and optic chiasm.
More classic symptoms in NMOSD include optic neuritis and transverse myelitis, the other core clinical characteristics which meet the criteria for NMOSD diagnosis. When area postrema syndrome does occur, it tends to precede involvement of the orbits or spinal cord and therefore can serve as a warning sign for progressive symptoms. Treatment of area postrema syndrome not only helps relieve symptoms of vomiting and hiccups but can also prevent subsequent episodes of optic neuritis or transverse myelitis.
Our patient also had optic neuritis, as shown in the bottom 2 pictures. Imaging features of optic neuritis include high T2 signal and abnormal enhancement of the optic nerve. In NMOSD, optic neuritis tends to occur bilaterally, whereas it is more often unilateral in the case of multiple sclerosis (although our patient shown above only has unilateral involvement).
References:
- Shosha E, Dubey D, et al. Area Postrema Syndrome: Frequency, Criteria, and Severity in AQP4-IgG positive NMOSD. 2018;91(17): e1642-1652.
- Hyun JW, Kwon YN, et al. Value of Area Postrema Syndrome in Differentiating Adults with AQP4 vs. MOG Antibodies. Frontiers in Neurology. 2020;11:396.
- Chan KH, Vorobeychick G. Area postrema syndrome: a neurological presentation of nausea, vomiting, and hiccups. BMJ Case Reports. 2020; 13: e238588.
- Dutra BG, et al. Neuromyelitis Optica Spectrum Disorders: Spectrum of MR Imaging Findings and Their Differential Diagnosis. 2018; 38(1): 169-193.
August 25, 2021: Diagnosis Penetrating Atherosclerotic Ulcer (PAU)
History: A 70-year old male with a history of hypertension and COPD presented to the Emergency Department with acute onset chest pain and shortness of breath.
Findings:
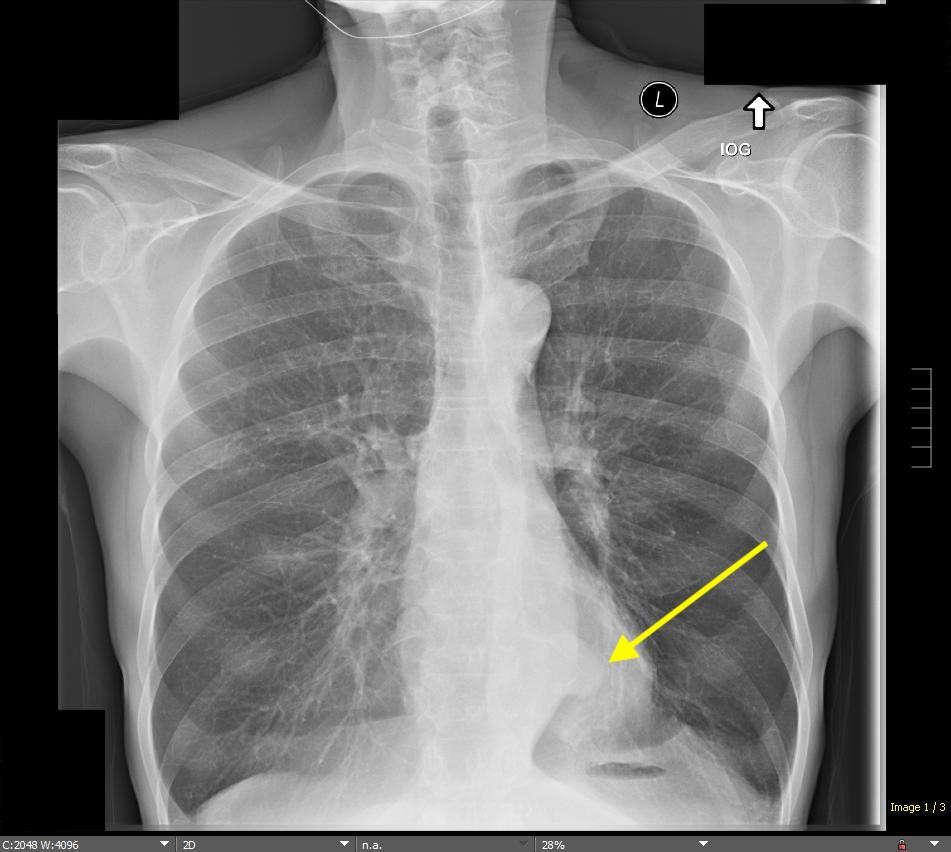
The initial chest radiograph obtained in the Emergency Department showed hyperinflation of the lungs and flattening of the diaphragms, which can be seen with COPD/emphysema. In addition, a focal opacity in the left retrocardiac region was seen, which appeared to silhouette the contour of the distal descending thoracic aorta. Given the history of acute chest pain, further evaluation with a CT angiogram of the chest was recommended.
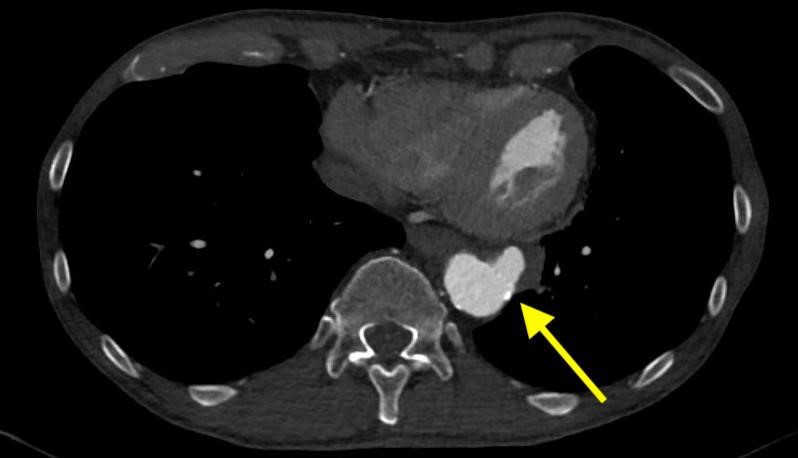
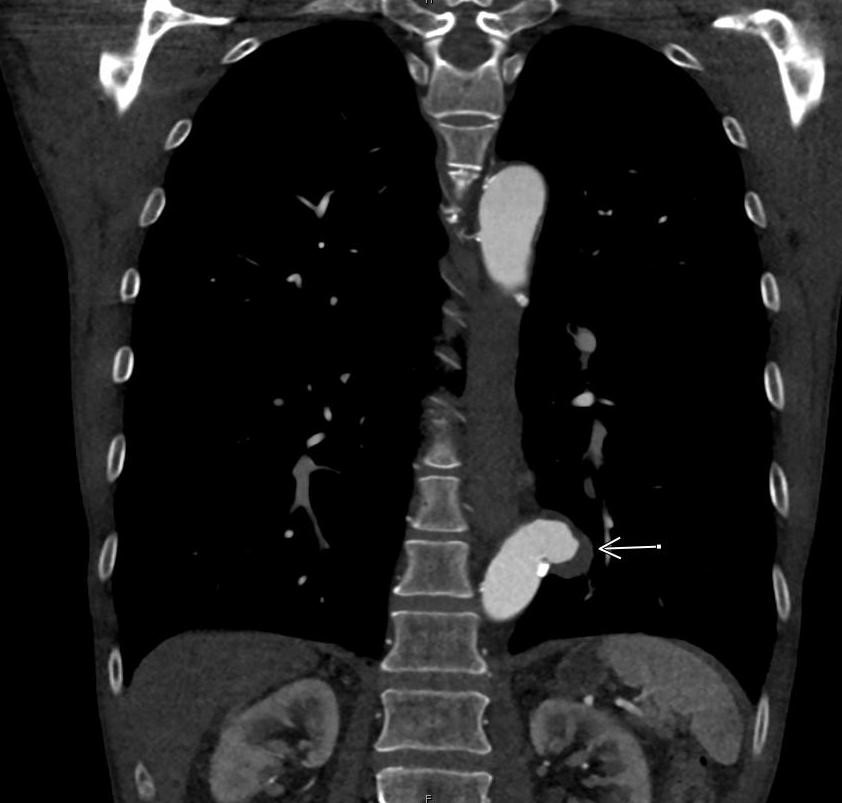
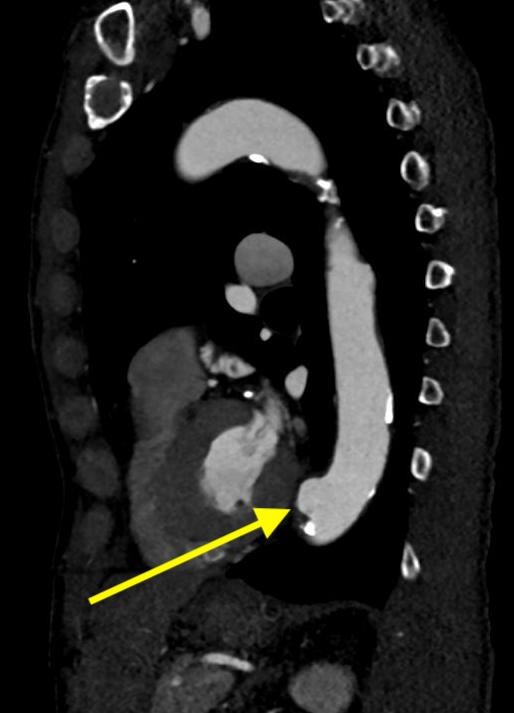
Three images from the CT angiogram of the chest demonstrate an irregularly shaped, focal outpouching of the distal descending thoracic aorta. This outpouching is contrast-filled, directed anterolaterally to the left, and measures approximately 2.5 x 2.1 x 1.7 cm. It is associated with an area of calcified atherosclerotic plaque. Soft tissue attenuation areas along the margins of this outpouching that do not fill with contrast likely represent a component of mural thrombus.
Diagnosis: Penetrating Atherosclerotic Ulcer (PAU)
Teaching Points:
A penetrating atherosclerotic ulcer (PAU) describes an atherosclerotic plaque that erodes the internal elastic lamina into the media of the aortic wall. They occur in regions of advanced atherosclerosis.
Patients with PAU present with the classic symptoms of the acute aortic syndrome, most commonly acute tearing chest pain. They tend to occur in the older male population with a history of hypertension, smoking, coronary artery disease, peripheral artery disease, and COPD.
CT angiogram is the test of choice for PAUs. Our case described above is interesting because we can actually detect the focal outpouching of the aorta on the chest radiograph. On CTA, PAUs appear as contrast-filled outpouchings off the wall of the aorta. They most often involve the aortic arch or mid-distal thoracic aorta. They occur in areas of advanced atherosclerosis as evidenced by jagged, irregular aortic walls from atheroma and the presence of intimal calcification.
In general, PAUs can be classified according to the Stanford classification in the same way as aortic dissections. PAUs occurring in the ascending aorta proximal to the left subclavian artery origin (Stanford type A) have a higher risk of rupture and are treated with early surgical intervention. PAUs that do not involve the ascending aorta (Stanford type B) can be managed with antihypertensive medication and imaging follow-up if asymptomatic or with endovascular repair if symptomatic and/or progressing.
PAUs can rupture and lead to intramural hemorrhage, which can subsequently cause a limited intermedial dissection, saccular pseudoaneurysm, or aortic rupture. If associated with intramural hematoma, non-contrast CT will show a high-density hematoma surrounding the PAU. Intramural hematomas associated with PAU have a worse prognosis compared to intramural hematomas in the absence of PAUs. PAUs actually have an even higher incidence of aortic rupture when compared to aortic dissection. PAUs measuring greater than 10mm in depth or 20mm in diameter have a higher rate of progression. Persistent or recurrent pain, as well as new/increased pleural effusions, are also important predictors of disease progression.
It is important to distinguish PAU from irregular atherosclerotic plaque, a very common finding in which atheromatous plaque causes irregular margins of the aortic wall. Still, no contrast material extends beyond the level of the intima.
References:
1. Maddu KK, Shuaib W, et al. Nontraumatic Acute Aortic Emergencies: Part 1, Acute Aortic Syndrome. American Journal of Roentgenology. 2014;202: 656-665.
2. Hayashi H, Matsuoka Y, et al. Penetrating Atherosclerotic Ulcer of the Aorta: Imaging Features and Disease Concept. Radiographics. 2000;20(4): 995-1005.
3. Ganaha F, Miller DC, et al. Prognosis of Aortic Intramural Hematoma With and Without Penetrating Atherosclerotic Ulcer. Circulation. 2002;106(3).
4. Macura KJ, Corl FM, et al. Pathogenesis in Acute Aortic Syndromes: Aortic Dissection, Intramural Hematoma, and Penetrating Atherosclerotic Aortic Ulcer. American Journal of Roentgenology. 2003;181: 309-316.
January 21, 2021: Uterine Didelphys
A pregnant woman in her 30's was noted to have a uterine anomaly during prenatal ultrasound. Patient now presents for MRI after successful delivery for further evaluation of this anomaly.
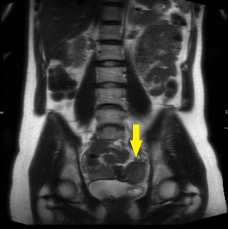
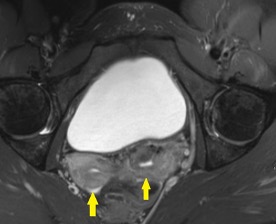
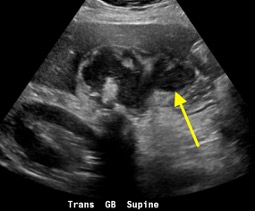
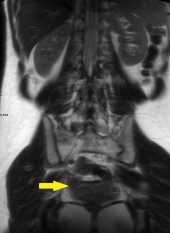
The above pictures show two widely-spaced uterine corpora and edometrial cavities with separate, non-communicating divergent uterine horns and a large fundal cleft.
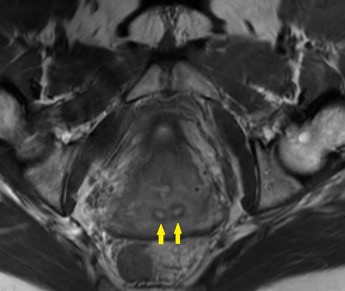
The above picture shows two separate cervices.
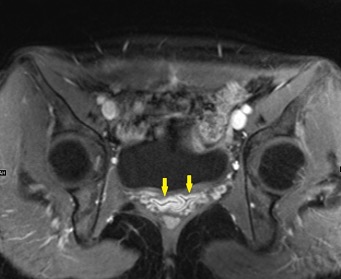
The above picture shows a partially duplicated vagina superiorly near the two cervices. The normal H-shaped appearance of the vagina is lost.
Diagnosis: Uterine Didelphys
Uterine didelphys is a type of Mullerian duct anomaly secondary to complete failure of ductal fusion. Normally, the Mullerian ducts fuse during the 6th to 11th weeks of gestation to form the uterus, Fallopian tubes, cervix, and upper 2/3 of the vagina. In uterine didelphys, however, the failed fusion resulted in complete duplication of the uterine horns and cervix.
Imaging findings include two widely-spaced uterine bodies and endometrial cavities, each with a single Fallopian tube. The divergent uterine horns are separated by a large fundal cleft. Two separate cervices are always present. In 75% of cases, there is also an upper vaginal septum.
Mullerian duct anomalies are commonly associated with renal anomalies, most commonly in the form of ipsilateral renal agenesis. Ectopia, hypoplasia, fusion, malrotation, and duplication are other renal anomalies that can be seen.
Vaginal septa may cause obstruction from one uterine horn and can result in subsequent hematometrocolpos (appearing on MRI as a markedly distended unilateral uterine horn with high T1 signal related to blood). In addition, vaginal septa can lead to retrograde menstrual flow and result in endometriosis, infection, and pelvic adhesions. In the absence of an obstructing vaginal septum, most patients with uterine didelphys are asymptomatic.
Successful pregnancy is possible in the setting of uterine didelphys, but remains relatively high risk in relation to the normal population. It most commonly occurs unilaterally. Breech presentation is common due to the reduced uterine volume. In addition, the nonpregnant uterus may block the pelvic inlet. For these reasons, cesarean sections are common in these patients.
Differential diagnosis includes bicornuate uterus and separate uterus. In a bicornuate uterus, only the uterine horns are separated and there is communication between them. In a separate uterus, a midline uterine septum is seen.
References
1) Behr SC, Courtier JL, Qayyum A. Imaging of Mullerian duct anomalies. Radiographics. 2012;32:233-50.
2) Dykes TM, et al. Imaging of Congenital Uterine Anomalies: Review and Self-Assessment Module. American Journal of Roentgenology. 2007; 189:S1-S10.
3) Felker EA. Uterus Didelphys and Pregnancy. Journal of Diagnostic Medical Sonograph. 2004; 20:131-133.
April 14, 2020: COVID-19 in Lung Screening
An older male with multiple comorbidities presented with nonspecific shortness of breath, found to be in florid heart failure. COVID-19 testing returned positive. Here’s what we are seeing on imaging throughout the admission.
Prior comparison CXR: clear, without significant evidence of underlying lung disease on radiographs.
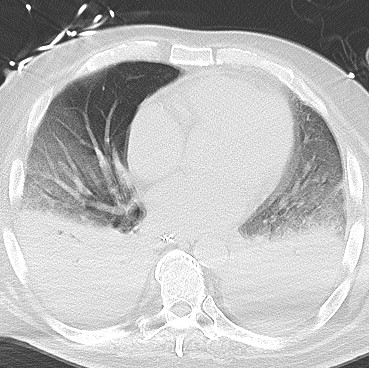
Admission CXR: Patchy bilateral airspace opacities with mild consolidation in the right lower lobe.
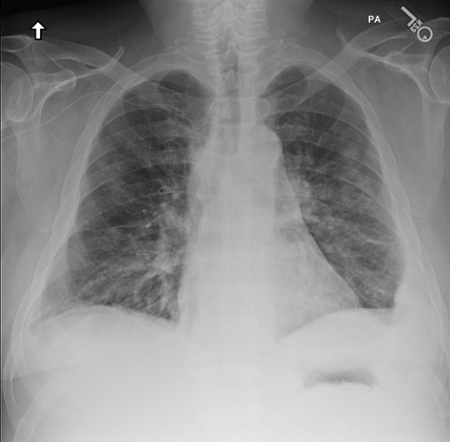
CXR 2 days later: florid progression of disease with extensive patchy airspace opacities throughout both lungs. Denser areas of consolidation are also seen more pronounced in the lower lobes.
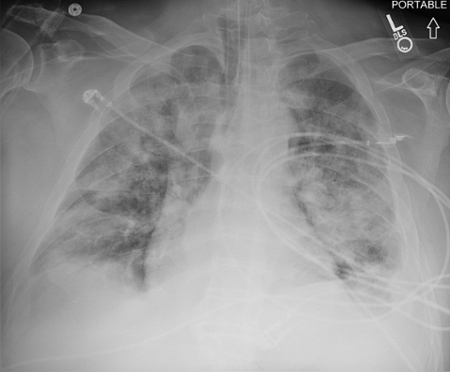
CT Chest (same day as above): Progressive ground-glass opacities with dense consolidation in the bilateral lower lobes, suspicious for pneumonia including atypical etiologies such as coronavirus. No pleural effusions.
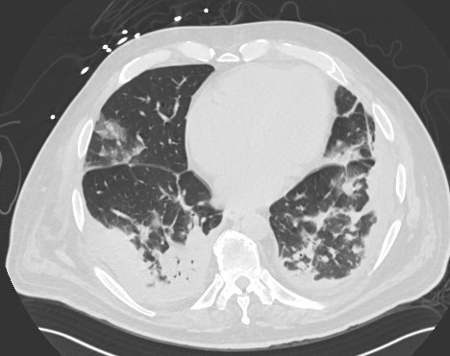
Follow-up CT Chest (almost 2 weeks after above exam): Progression of extensive ground-glass opacities throughout the lungs with a slight peripheral predominance, as well as progressive dense consolidation of the lower lobes. No pleural effusions.
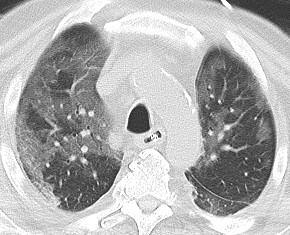
Clinical Bullet Points
- Nonspecific clinical presentation delays or precludes diagnosis in many cases.
- Clinical diagnosis is by RT-PCR, with a known significant false negative rate. New rapid testing is being developed with goals of higher sensitivity.
- Complications include ARDS, acute cardiac injury, secondary infection (bacterial pneumonia), sepsis, AKI, multiorgan failure.
Imaging Bullet Points:
- Here’s a summary of what the Fleischner Society consensus published 7 April 2020:
- Imaging is not indicated in patients with suspected COVID-19 and mild clinical symptoms
- Imaging is indicated in a COVID-19 patient with worsening respiratory symptoms
- In the setting of resource limitations, imaging is indicated for medical triage of patients with suspected COVID-19 presenting with moderate-severe clinical features and high pretest probability.
- Key Imaging features: findings of atypical pneumonia or organizing pneumonia in the setting of clinical suspicion for COVID-19:
- Plain Radiograph: airspace opacities (consolidation or ground-glass opacities); bilateral, peripheral, lower lung predominant; pleural effusion is rare.
- May be normal in early disease
- Findings are most extensive 10-12 days after symptom onset
- Chest CT:
- Ground-glass opacities (GGOs) - bilateral, peripheral/subpleural
- Crazy paving (GGOs with interlobular septal thickening)
- Air space consolidation
- Bronchovascular thickening
- Traction bronchiectasis
- Many asymptomatic patients may have CT abnormalities.
- Plain Radiograph: airspace opacities (consolidation or ground-glass opacities); bilateral, peripheral, lower lung predominant; pleural effusion is rare.
Take home point: Peripheral distribution, predominantly ground-glass opacities without pleural effusions should raise suspicion for COVID-19 in the appropriate clinical setting
April 20, 2020: Identifying an Abnormal Enhancement Pattern
This week, we have a younger gentleman with multiple comorbidities. On the supplied image we see hyperenhancement of the liver - specifically in segment IV as well as multiple abnormal collateral vessels throughout the abdominal wall.
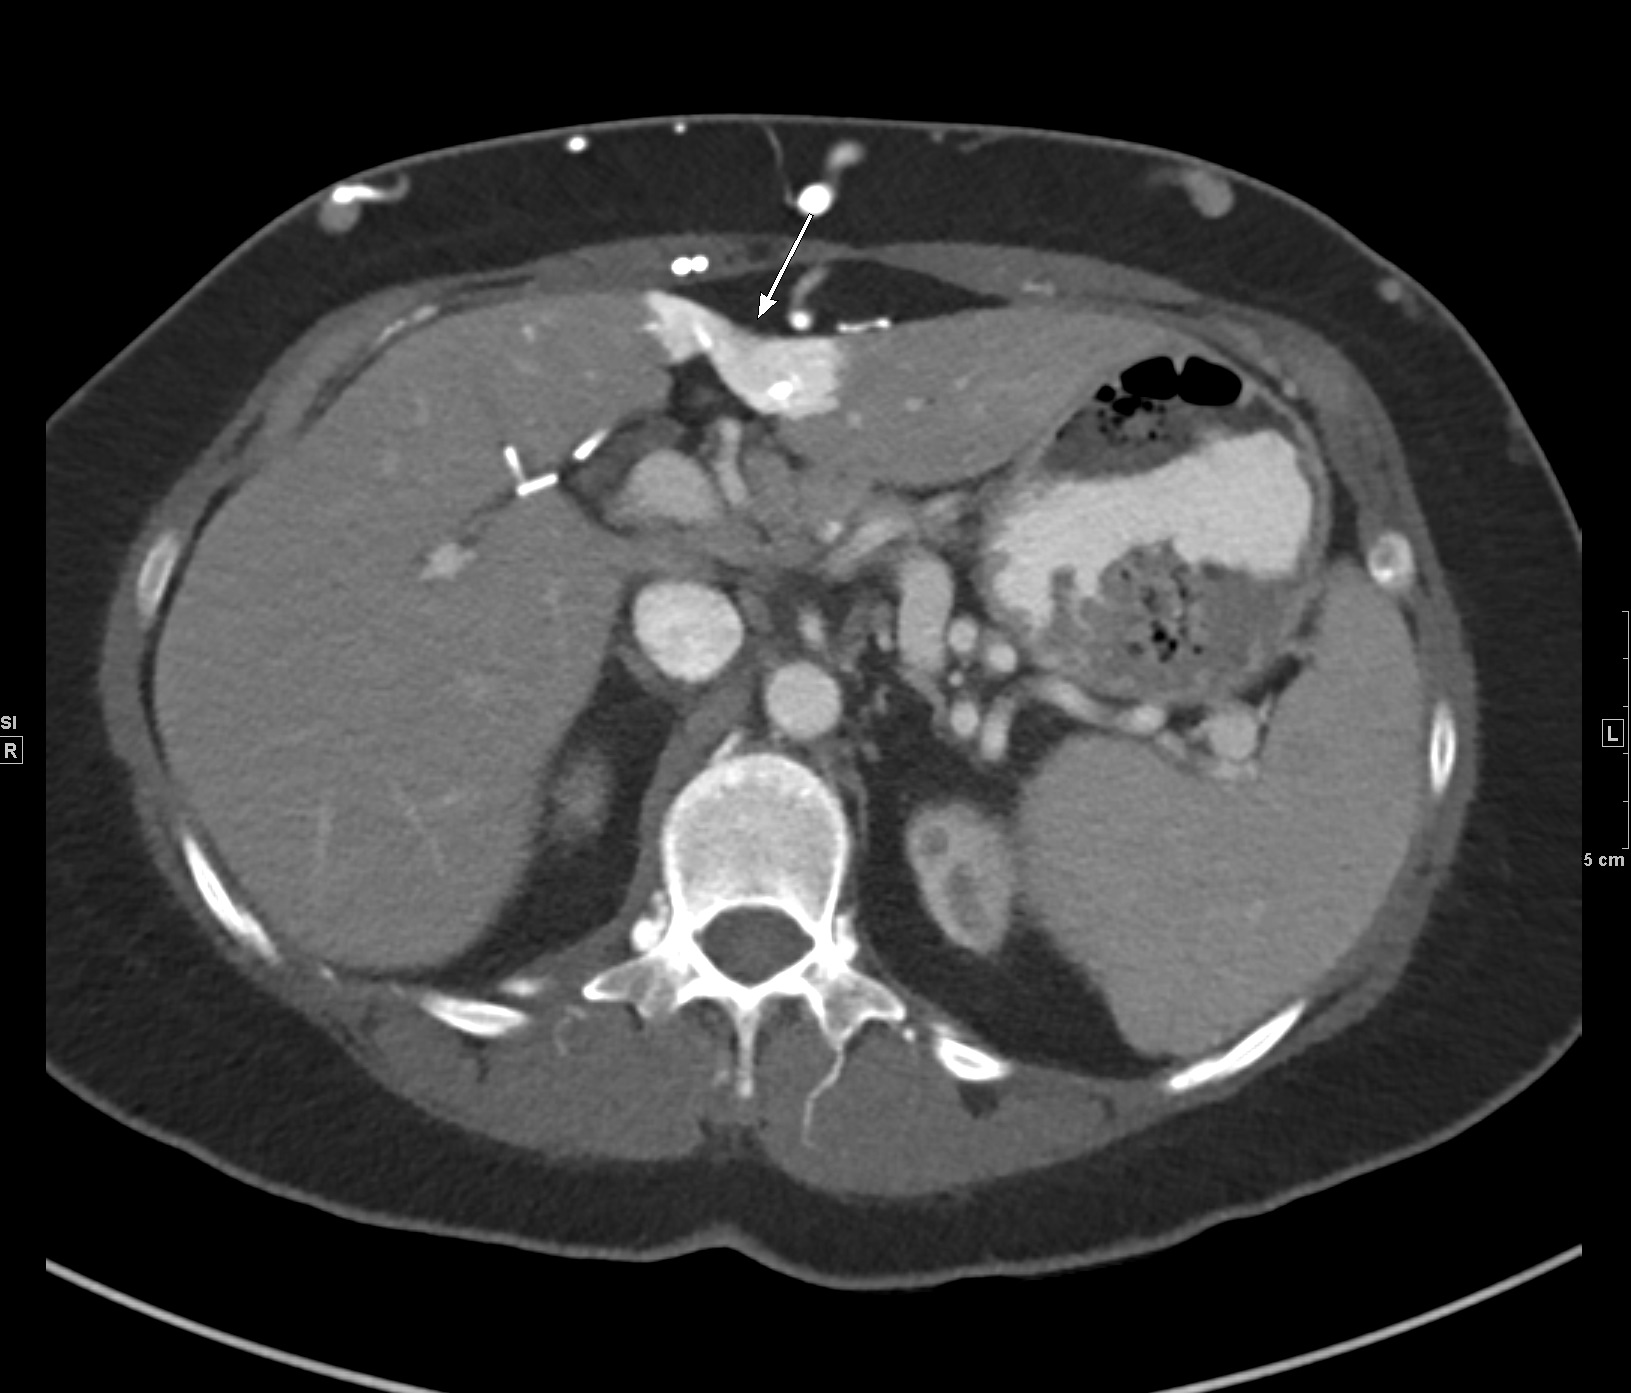
Hot quadrate sign refers to a focal area of increased enhancement in the medial segment of the left hepatic lobe (segment IV). This finding is classically due to obstruction of the superior vena cava with portosystemic venous shunting between the SVC and left portal vein (via the internal thoracic and paraumbilical veins). This is contrasted with the Budd-Chiari syndrome which causes hypervascularity of the caudate lobe due to differential venous outflow.
Key point: Identifying the abnormal enhancement in this specific location as well as the collaterals suggests pathology elsewhere (in the SVC).
April 25, 2020: Hand Joint Swelling Without Joint Space Destruction
A middle-aged man came in with hand pain and swelling.
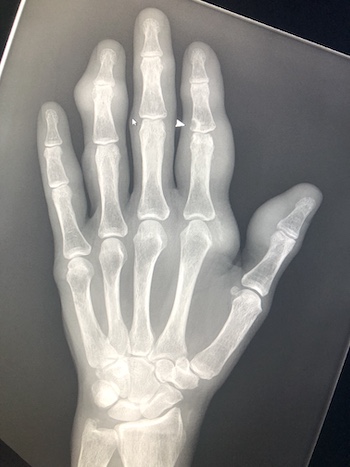
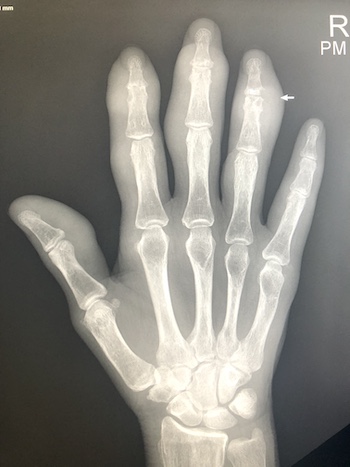
There is nodular soft tissue swelling of several fingers and mild osteoarthritis (joint space narrowing and osteophytosis) of several joins in a distal distribution, favoring DIPs. There are few erosions which are characterized as juxtaarticular erosions, meaning the lucencies are not actually along the join but outside of the synovial covering of the joint space. (See the small arrows.) A few areas of mineralization are seen in the soft tissues as well.
A notable negative is that the MCPs are essentially unaffected.
Diagnosis: Gouty arthritis.
Key takeaways: This case is an example of a bunch of gouty tophi around the joints. The swelling around the joins is classic due to the urate crystal deposits around the joint. These can calcify (see the mineralization around the radial side of the second MCP on the left hand). The urate deposits cause an inflammatory reaction that can result in bone resorption and lytic foci in the juxtaarticular bone. This is not within the synovial joint, hence why we're not seeing joint space destruction.
May 4, 2020: Diagnosing Inflammatory Breast Cancer
A middle-aged woman with a palpable abnormality. She noted her skin has been red and tender on her left breast.
Findings: The first image shows the initial evaluation demonstrating a mass in the outer left breast with mild skin thickening. Remaining images are a follow-up diagnostic mammogram workup months after.
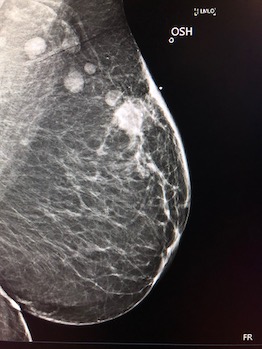
This case shows a large irregular mass in the upper-outer left breast (2 o'clock position), with remarkable skin thickening throughout the left breast. There's a trabecular thickening and slightly increased density of the left breast overall.
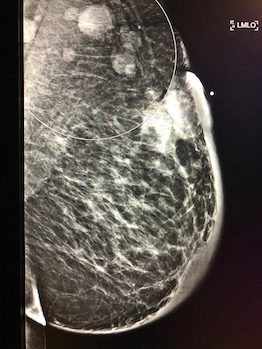
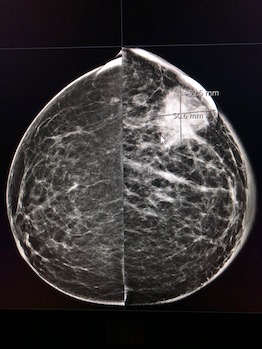
If you look closely, there's a small calcification associated with the mass as well as a biopsy clip -- a finding that should should raise the radiologist's suspcions for cancer. Other findings include multiple enlarged left axiliar nodes in the LMO projection. US shows a large irregular hypoechoic mass without shadowing.
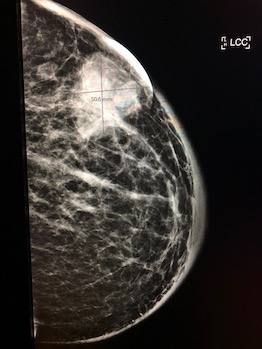
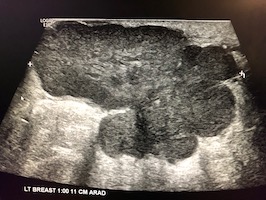
Diagnosis: Inflammatory breast cancer - a clear case for BIRADS 5.
Inflammatory breast cancer is a diagnosis that requires both tissue biopsy and clinical evidence of inflammatory disease. It is a common occurrence for a middle-aged woman to come in having developed a hot, swollen breast very rapidly, sometimes showing the peau d'orange appearance clinically. This appearance is due to tumor invasion of the skin lymphatics so tissue sparing surgeries are generally not performed. Up to 30% of these cancers are metastatic at presentation. Inflammatory breast cancer itself is considered stage IIIb at presentation due to skin invasion so immediate action is required.
An important distinction: DDX is mastitis clinically. Mastitis is usually related to breast feeding so the patient can be younger. This should be resolved with therapy. Inflammatory breast cancer can also be associated with pregnancy, which is something to look out for.
June 1, 2020: Left Lower Lobe Atelectasis On Chest X-ray
A 50 year-old female presented to the hospital with shortness of breath. She had a history of breast cancer. A chest X-ray was ordered.
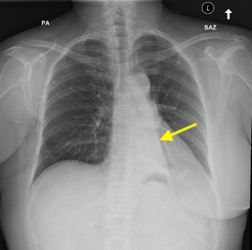
A PA view of the chest demonstrates the classic findings of left lower lobe atelectasis. The retrocardiac sail sign describes a triangular opacity in the posteromedial aspect of the left lung (shown with the yellow arrow). The flat waist sign describes flattening of the left heart border as is also shown in this example. There is also slight inferior displacement of the left hilum. On this example, the hila are approximately level with eachother whereas the left hilum is normally slightly superior to the right hilum.
A repeat chest radiograph the following day demonstrates persistent left lower lobe atelectasis with suggestion of an abnormal density within the left mainstem bronchus. CT was recommended for further evaluation.
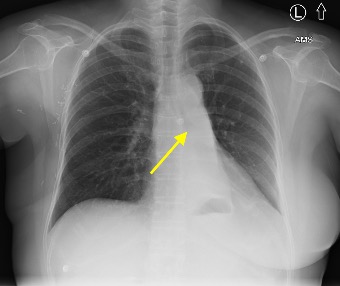
The CT showed a 2.6m mass in the left hilar region that completely obstructs the left lower lobe bronchus and results in complete collapse of the left lower lobe. Bronchoscopic biopsy was recommended for further evaluation.
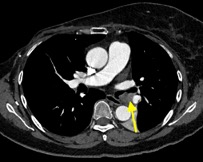
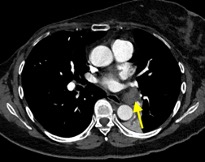
Diagnosis: The left hilar mass resulting in obstruction of the left lower lobe bronchus. Differential includes primary lung or bronchogenic malignancy, as well as metastasis. Bronchoscopic biopsy in this case confirmed a primary squamous cell carcinoma.
This case shows typical findings for left lower lobe atelectasis on chest X-ray. It is important to be aware of the radiographic appearance of all types of lobar atelectasis.
It is also a good example of the satisfaction of search phenomenon. On the second X-ray, it would be easy to call this persistent left lower lobe atelectasis. However, you should always look further for the cause of the lobar collapse as seen in this instance.
The differential for an endobronchial lesion is broad. In children, central obstruction is most often due to a mucus plug or foreign body. In young adults, a low-grade endobronchial tumor such as carcinoid or adenoma enters the differential. After age 40, bronchogenic carcinoma is a common cause.
June 15, 2020: Ultrasound Diagnosis of Median Arcuate Ligament Syndrome
A 30 year-old female presented with epigastric pain and nausea after eating. An epigastric bruit was noted on the physical exam. Ultrasound was ordered to look for abdominal aortic aneurysm.
Findings show, during expiration there is narrowing of the origin of the celiac artery with a fish-hook configuration.
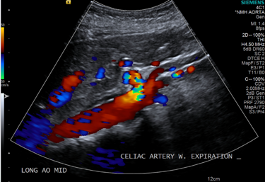
With inspiration, the celiac artery assumes a more vertical orientation with decreased narrowing at its origin.
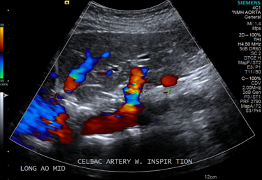
A side-by-sie view demonstrates the difference in orientation of the celiac artery during expiration and inspiration.
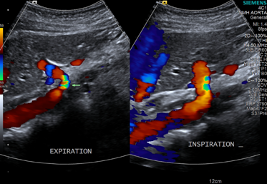
During expiration, there is elevation of the peak systolic velocity of the celiac artery to 297 cm/ sec. There is also focal aliasing at the origin of the celiac artery, indicative of turublent high-velocity flow.
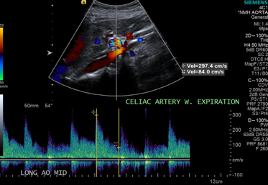
During inspiration, there is normalization of the peak systolic velocity to 171 cm/ sec and resolution of the focal aliasing at the origin of the celiac artery.
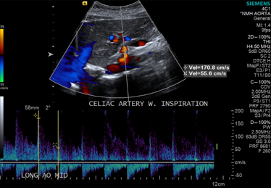
Diagnosis: Median arcuate ligament syndrome
Median arcuate ligament syndrome, also known as celiac artery compression syndrome, is a condition in which the proximal part of the celiac trunk is compressed by the median arcuate ligament of the diaphragm during expiration. This ligament is a fibrous arch that connects the diaphragmatic crura on either side of the aortic hiatus.
During inspiration, the celiac artery descends in the abdomen and the artery assumes a more vertical orientation, relieving the compression. For this reason, the symptoms associated with MALS are also relieved during standing as the celiac artery descends further in the abdominal cavity on standing.
On ultrasound, this can be diagnosed when there is narrowing at the origin of the celiac artery (often with a fish-hook orientation) and a peak systolic velocity in the compressed segment of the celiac artery >200 cm/ sec during expiration. There should also be a >3:1 ratio of peak systolic velocity in the celiac artery during expiration compared to the peak systolic velocity in the abdominal aorta immediately below the diaphragm. Normalization of the velocity on inspiration and standing is classic.
CT is the more common method to diagnose this condition. On CT, you will see proximal celiac stenosis with the classic fish-hook configuration. You may also see post-stenoic dilation and prominent collaterals as seen int he example below obtained from Dr. Mahmoud Yacout Alabd on Radiopaedia.org.
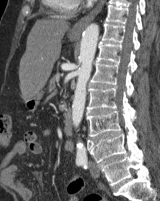
This is often treated surgically with laparoscopic division of the median arcuate ligament.
June 22, 2020: Dysphagia lusoria
A 70 year-old male reported dysphagia and sensation of food getting stuck at the level of the suprasternal notch. A fluoroscopic esophagram was ordered for further evaluation.
Frontal and lateral views show a mild posterior and lateral impression on the upper thoracic esophagus at the level of the aortic arch. Note that there is also laryngeal penetration and a small amount of tracheal aspiration in the second picture due to the patient's difficulty swallowing.
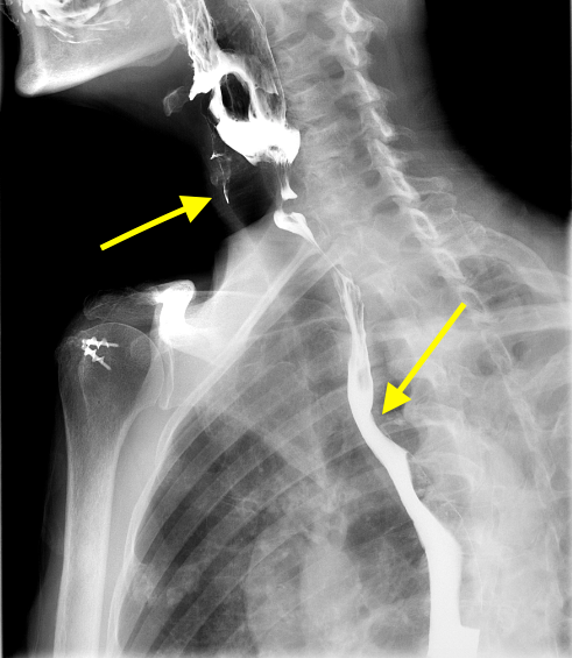
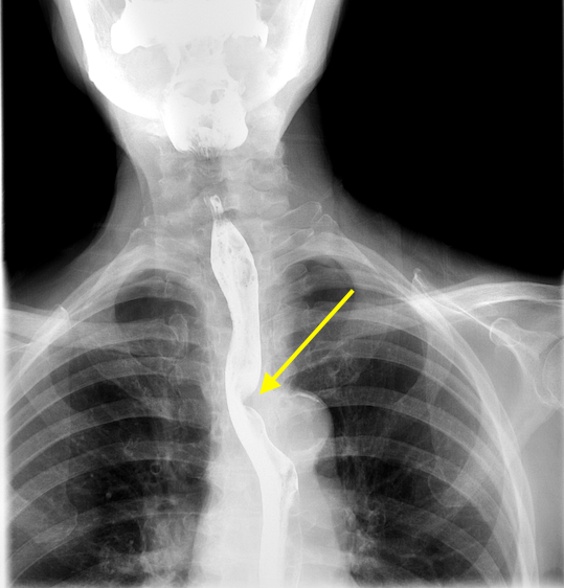
There is also a cricopharyngeal bar at the C5-C6 level causing greater than 50% impression on the posterior cervical esophagus.
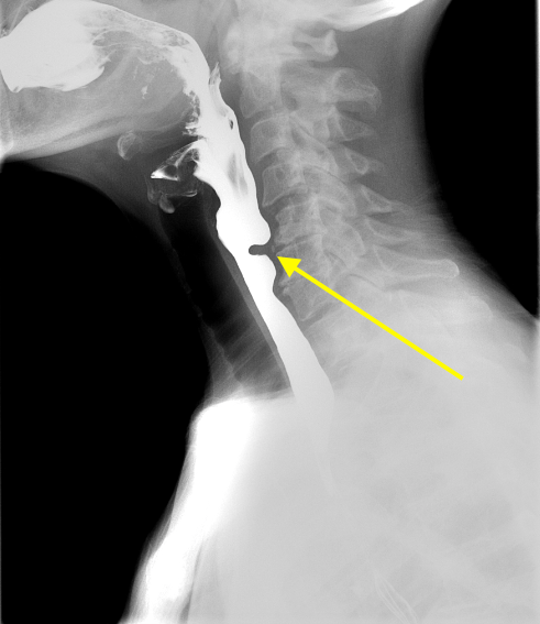
Subsequent CT of the chest demonstrates an aberrant right subclavian artery which courses posterior to the esophagus and causes posterior compression on the esophagus. Note the calcific atherosclerosis at the origin of the aberrant right subclavian artery.
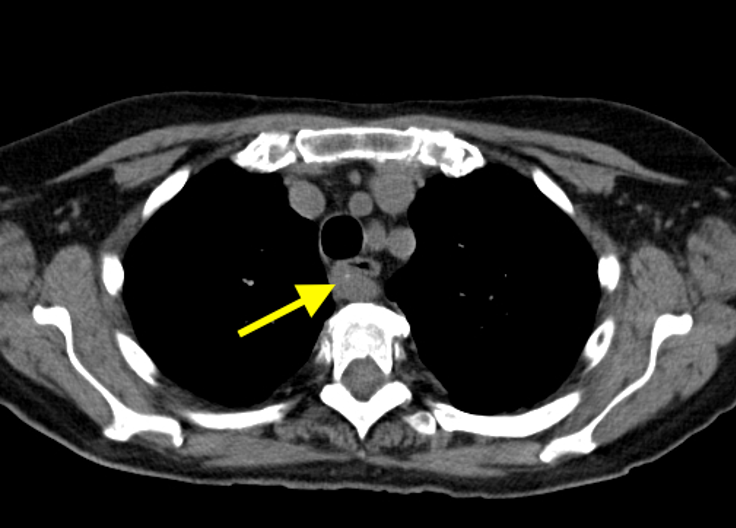
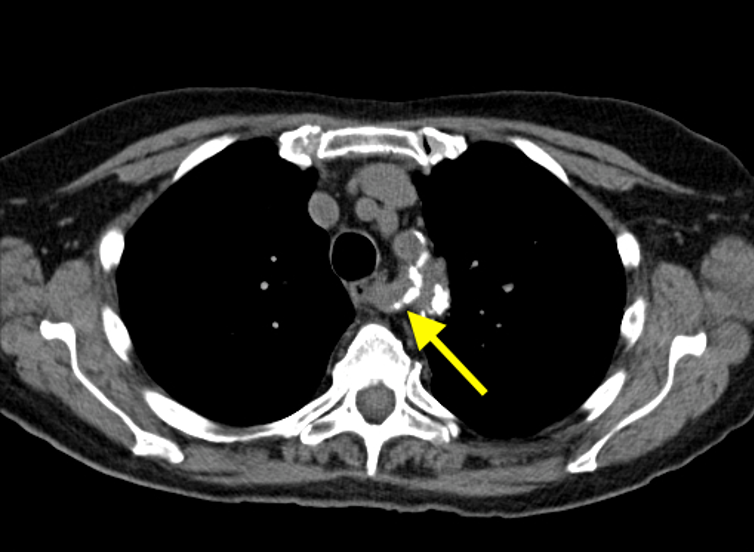
Diagnosis: Dysphagia lusoria and cricopharyngeal bar
Dysphagia lusoria is impairment in swallowing due to an aberrant right subclavian artery. Fluoroscopy will show an indentation in the posterior wall of the esophagus at the level of the aortic arch. Cross-sectional imaging is necessary to confirm the presence of the aberrant vessel. It is important to note that most patients with an aberrant right subclavian artery do not have symptoms. As in this case, the presence of atherosclerosis or aneurysm in the aberrant artery will often lead to worse symptoms.
A cricopharyngeal bar will appear on lateral fluoroscopic images as a smooth posterior indentation of the cervical esophagus at the C5-C6 level - which is the level of the cricopharyngeus muscle. It can be idiopathic or related to cricopharyngeus muscle spasm or hypertrophy. It is usually an incidental finding. However, some patients complain of dysphagia. It can result in a Zenker diverticulum so be sure to look for that as well.
July 13, 2020: Golden S-Sign
This week, an older gentleman reported progressive shortness of breath.
What we are seeing in the CXR is the Golden S-sign or S-sign of Golden. Here, the right upper lobe collapse is related to a mass in the hilum. As the right upper lobe collapses, it pulls the minor fissure upwards and the hilar mass impresses on the fissure downwards resulting in the S-shape.
This is one of the signs residents learn about but don't often see. This, like many radiologic signs, were really important in the days before CT. Radiologists at that time were amazing at plain film interpretation.
In this case, we have an image of a quick scan through the CT showing the mass and the right upper lung bronchus that's almost collapsed. The presenting X-ray a few months after the CT shows a complete collapse. The other image is the prior X-ray before the right upper lung collapse.
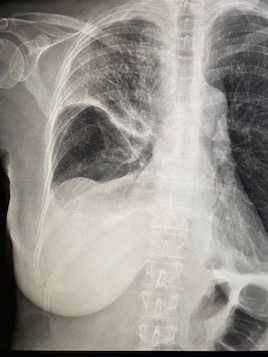
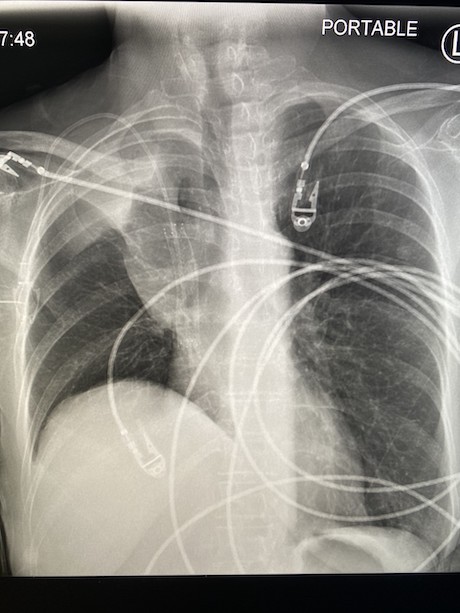
July 27, 2020: Testicular Torsion
A man in his 60s with a history of right inguinal hernia repair within the past year is now presenting with several weeks of right testicular pain.
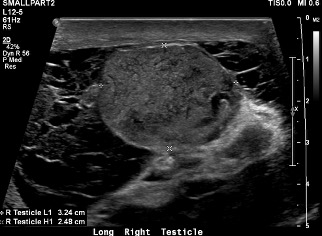
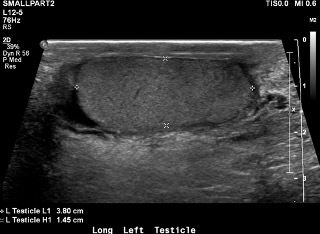
The echotexture of the right testicle is heterogeneous when compared to the normal homogenous echotexture of the left testicle. The hypoechoic (dark) regions within the testicle represent areas of necrosis. Note also the large complex hydrocele surrounding the necrotic right testicle with multiple septations, which is reactive in the setting of testicular torsion.
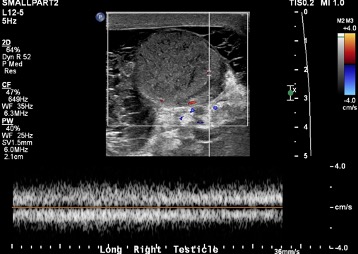
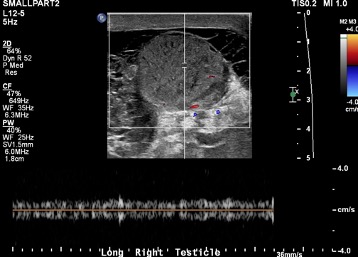
Doppler images of the right testicle demonstrate no evidence of arterial or venous blood flow. Absence of blood flow within the testicle is a sign of complete torsion.
Compare the absent arterial and venous waveforms of the right testicle shown above to this normal arterial waveform in the left testicle. Note the arterial waveforms with sharp systolic upstrokes -- a normal finding.
The cine clip shown above shows the classic "whirlpool sign" of twisting of the right spermatic cord including the vascular pedicle.
Diagnosis: Testicular Torsion with Necrosis
This is a classic case of complete testicular torsion with necrosis. This occurs when the spermatic cord and vascular pedicle twist and cut off blood supply to the testicle. Initially, the twisting is less than 360 degrees and only obstructs the venous outflow (incomplete torsion). Over time, as the twisting becomes greater than 360 degrees, the arterial inflow is also obstructed (complete torsion) and the testicular necrosis occurs.
These patients usually present with acute testicular pain. Early diagnosis is important so that the testicle can be salvaged before testicular necrosis or infarction occurs. The time between onset of pain and detorsion is directly related to testicular salvage with nearly 100% salvage if the detorsion occurs within six hours. Only 20% salvage is expected if there is a delay of 12-24 hours. Treatment involves orchiectomy in order to prevent subsequent infection of the necrosed testicle.
A review of the typical ultrasound findings, many of which are shown above:
- Twisting of the spermatic cord or "whirlpool sign" (the most sensitive and specific finding)
- Absence of blood flow in complete torsion; elevated resistive indices or to-and-fro flow in incomplete torsion
- Homogenous texture early on before necrosis occurs; heterogeneous echotexture with areas of necrosis in late presentations
- Reactive hydrocele
- Reactive thickening of scrotal skin
August 3, 2020: Subdural Hematoma
A male in his 60s presents to the Emergency Department with acute onset of slurred speech. Stroke code was activated.
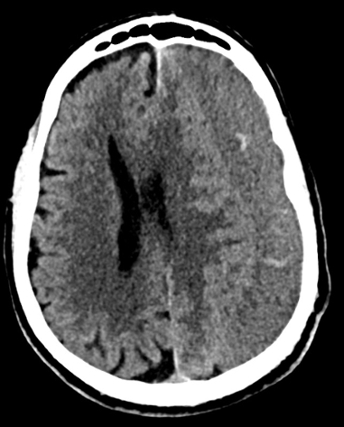
Findings show a large, mixed attenuation subdural hematoma overlying the left frontoparietal cerebral convexity with hyperdense (bright) components with acute blood products.
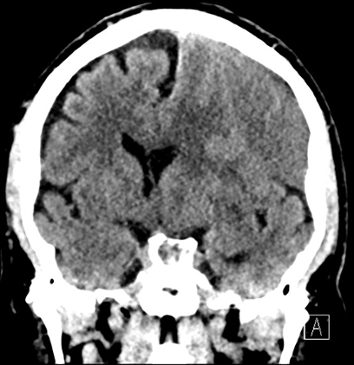

The large subdural collection results in significant effect with effacement/ flattening of the underlying cerebral gyri and 1.4 cm of left-to-right midline shift at the level of the septum pellucidum. The coronal image above nicely demonstrates subfalcine herniation and the axial image demonstrates mild effacement of the left aspect of the suprasellar cistern, indicative of developing uncal herniation.
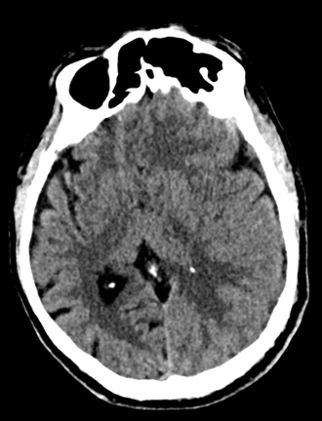
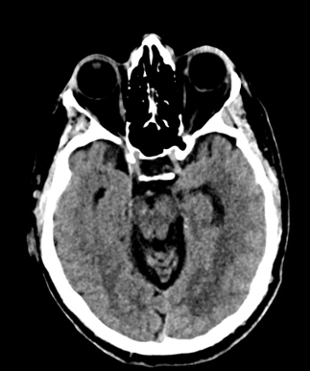
There is also effacement of the atrium of the left lateral ventricle (shown on the left) and asymmetric dilatation of the temporal horn of the left lateral ventricle (shown on the right). These findings are related to ventricular trapping from mass effect by the large subdural collection.
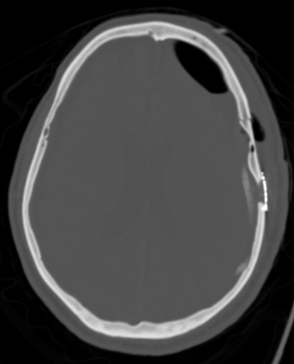
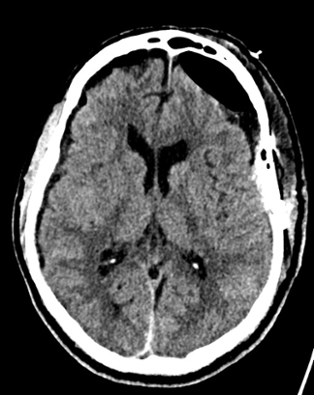
Due to the significant mass effect and developing herniation, the patient underwent emergent craniotomy for decompression. On the left, you can see the postsurgical changes including a subdural drain that was left in place for drainage of the large hematoma. On the right, you can see the significantly decreased mass effect after surgery including decreased midline shift and decreased effacement of the atrium of the left lateral ventricle.
Diagnosis: Subdural hematoma requiring emergent decompressive craniotomy
Subdural hematomas are collections of blood located between the dura and arachnoid mater. They occur from tearing of the bridging cortical veins as they cross the subdural space before draining into a dural venous sinus. They are often crescent-shaped and are not limited by cranial sutures, which is why the subdural collection in this case extends across nearly the entirety of the left cerebral convexity.
This is in opposition to epidural hematomas, which are often secondary to tearing of the middle meningal artery in the presence of a skull fracture. They appear lens-shaped and are limited by cranial sutures.
On CT, the appearance of the subdural hematoma changes with time. In the first hour (hyperacute stage), the collection often has a swirling appearance due to mixing of clot and ongoing unclotted blood. In the acute stage, they key imaging feature is hyperdense (bright) blood as seen in our case here. In rare cases, acute SDH can appear isodense to the brain due to anticoagulation/ coagulopathy or severe anemia. In the subacute phase (3-21 days), the collection becomes isodense to the underlying cortex. In the chronic phase (beyond 3 weeks), the collection becomes hypodense (dark) relative to the cortex. An acute-on-chronic SDH will often appear with a hematocrit level, with a hyperdense component layering posteriorly.
Treatment depends on the degree of mass effect. Small subdural collections are often managed with serial CT scans to exclude enlargement. Symptomatic cases with a large amount of mass effect, as seen in our case, require surgery to evacuate the collection.
August 28, 2020: Imaging Sign for Acute Infarct
A patient presented at the hospital after experiencing a few hours of left-sided weakness following trauma.
The initial non-contrast CT was mostly unremarkable without any bleed or big infarct visible on CT. What can be seen adjacent to the suprasellar cistern is a hyperdense curvilinear structure in the region where one would normally expect the M1 segment of the right MCA. Typically, these vessels can be visualized on a few slices on noncontrast CT but the appearance here is far more dense.
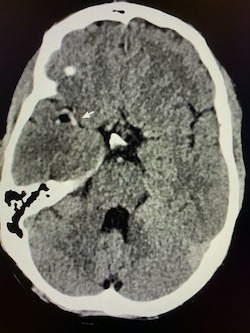
This finding should raise suspicions for an obstructing thrombus in the vessel - the so-called "hyperdense MCA sign." Oftentimes, clinicians reviewing imaging will think they see a dense MCA but it's usually just an artifact. If the appearance is for hyperdense MCA - if the clinical picture fits and if the patient is within the window for treatment - vascular imaging is a must.
Here, we got a CTA which shows complete occlusion of the distal M1 segment of the right MCA in the same region as the hyperdense MCA. This finding confirms our suspicion that the patient was taken for mechanical thrombectomy.
Also shown was complete occlusion of the internal carotid artery on the same side due to a bad acute dissection.
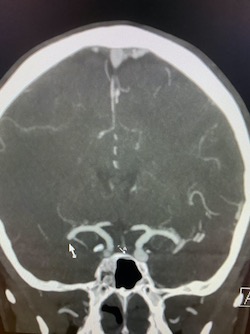
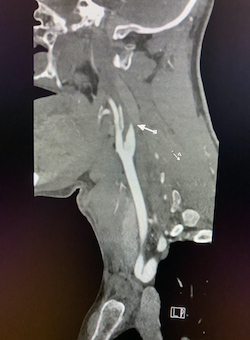
The following MRI shows a large right MCA territory infarct with increased signal on DWI and corresponding low ADC signal (diffusion-restriction). A tiny infarct in the left frontal lobe suggests this is all related to showering emboli from the ICA dissection.
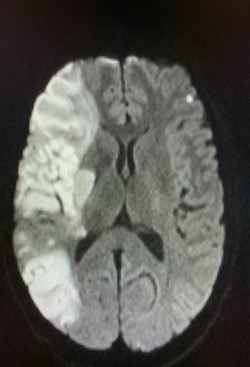
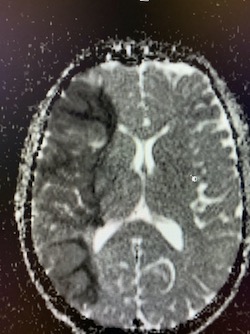
Follow-up vascular imaging post-thrombectomy shows reconstitution of the right ICA AND MCA.
The hyperdense MCA sign is the earliest visible sign of MCA infarction - seen within 90 minutes after the event. The sensitivity is very low, however, at 30%, the absence of this sign doesn't rule out pathology.
The finding is, as it sounds, just hyperdensity of the MCA relative to the other side and basilar artery. Be careful not to overcall this on just thick axial slices as there can be asymmetry. Use thin-section CT and multiplanar reformats to confirm in addition to vascular imaging.
References:
Chayhan GB, Shroff MM. Twenty classic signs in neuroradiology: A pictoral essay. Indian J Radiol Imaging. 19 (2): 135-45. doi: 10.4103/0971-3026.50835
Tomsick T, Brott W, Broderick J, Haley EC, Spilker J, Khoury J. Prognostic value of the hyperdense middle cerebral artery sign and stroke scale score before ultraearly thrombolytic therapy. (1996) AJNR. American journal of neuroradiology. 17 (1): 79-85.
December 7, 2020: Active Inflammatory Crohn's Disease
A female in her 40s presented at the Emergency Department with acute-on-chronic abdominal pain and diarrhea. CT abdomen and pelvis was ordered.
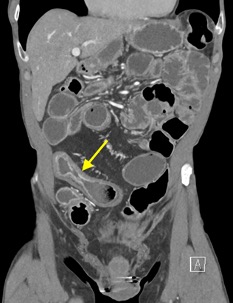
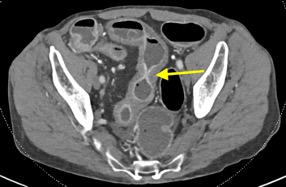
The pictures above show a long segment of markedly thickened, inflamed bowel most prominently involving the mid-distal and terminal ileum. There is associated mucosal hyperenhancement of the thickened bowel loops. Some of the involved bowel loops show mural stratification with low attenuation of the thickened wall relating to submucosal edema juxtaposed with mucosal hyperenhancement.
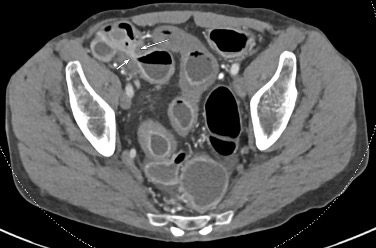
Multiple strictures with areas of focal luminal narrowing and interposing regions of relative dilation are seen throughout the involved bowel segments, representing sites of fibrosis from prior bouts of active inflammation.
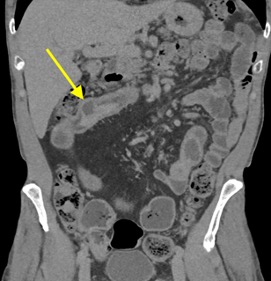
The picture above shows a pseudosacculation or pseudodiverticulum, which is a broad outpouching of normal bowel wall along the anti-mesenteric side, secondary to retraction / scarring of the opposite bowel wall from chronic ulcers.
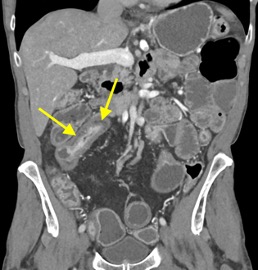
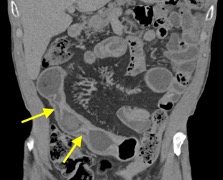
The involved bowel segments demonstrate intramural fat deposition, shown as thin, hypodense (fat density) layers within the bowel wall. This is known as "fat halo" sign.
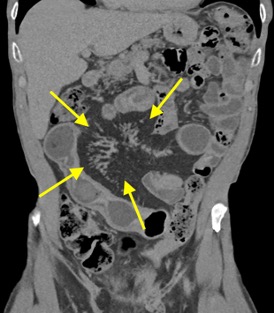
In addition to the bowel findings described above, this patient also has engorgement of the vasa recta ("comb sign") and mesenteric hyperemia.
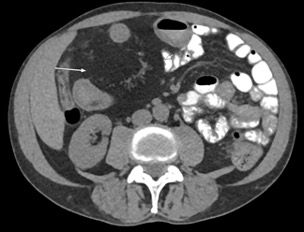
The picture above shows fibrofatty proliferation of the mesenteric fat ("creeping fat") along the mesenteric border of the involved bowel segments.
Diagnosis: Active Crohn-related bowel inflammation
Teaching points:
Crohn disease is an idiopathic chronic granulomatous inflammatory bowel disease. It is most common in young adults, and often presents wtih abdominal pain and diarrhea.
Characteristic features include:
- Discontinuous involvement of the entire gastrointestinal tract from mouth to anus ("skip lesions")
- Usually involves the small bowel, and almost always involves the terminal ileum
- When involving the stomach, it favors the gastric antrum
- When involving the colon, it favors the right side / ascending colon and often spares the rectosigmoid colon
- Forms strictures secondary to chronic fibrotic change (marked narrowing at the terminal ileum / ileocecal valve, often termed "string sign")
- Transmural inflammation with linear longitudinal and circumferential ulcers extending deep into bowel wall lead to formation of fistulae
- Mesenteric abscess formation
- Perianal abscesses and fistulae
- Increased risk of small bowel and colonic adenocarcinoma and lymphoma, preferentially involving the distal and terminal ileum
Many of the most standard CT findings are shown above. CT findings indicative of active Crohn inflammation include:
- Bowel wall thickening
- Mucosal hyperenhancement
- Mural stratification: juxtaposition of mucosal hyperenhancement with hypodense submucosal edema in the thickened bowel wall
- Engorgement of the vasa recta ("comb sign") and mesenteric hyperemia
CT findings of chronic Crohn disease include:
- Intramural fat deposition: This is a nonspecific finding. In patients with acute symptoms and preferential involvement of the terminal ileum, it may be related to Crohn disease. If preferentially involving the duodenum and proximal jejunum, it may relate to celiac disease. However, in a patient without a history of inflammatory bowel disease, it is most often related to obesity.
- Strictures representing sites of fibrosis from prior bouts of active inflammation. These strictures can lead to true bowel obstructions.
- Fibrofatty proliferation of mesenteric fat along mesenteric border of involved bowel segments ("creeping fat")
- Pseudosacculation / pseudodiverticulum on anti-mesenteric border of bowel wall secondary to scarring of opposite bowel wall from chronic ulcers
- Abscesses and fistulae
Extraintestinal features of Crohn disease include: gallstones, hepatic abscesses, pancreatitis, sacroiliitis, erythema nodosum, uveitis, oxalate renal stones, and many more.
Treatment includes medical management with steroids and immunomodulating agents. Surgery is often necessary in cases with strictures, bowel obstructions, fistulae, and perianal disease.
References:
- Raman SP, Horton KM, Fishman EK. Computed tomography of Crohn's disease: The role of three dimensional technique. World J Radiol, 2013; 5(5):193-201. doi:10.4329/wir.v5.i5.193
- Furukawa A, Saotome T, Yamasaki M et al. Cross-sectional imaging in Crohn disease. Radiographics 2004;24(3):689-702.
- Gore RM, Balthazar EJ, Ghahremani GG et al. CT features of ulcerative colitis and Crohn's disease. AJR Am J Roengenol. 1996;167 (1):3-15.
- Lee SS, Kim AY, Yang SK et al. Crohn disease of the small bowel: comparison of CT enterography, MR enterography, and small-bowel follow-through as diagnostic techniques. Radiology. 2009;251 (3): 751-61.
December 14, 2020: Acute Cholecystitis with Perforated Gallbladder
A man in his 60s presented at the Emergency Department with right upper quadrant pain and leukocytosis. Right upper quadrant ultrasound was obtained followed by a CT abdomen and pelvis.
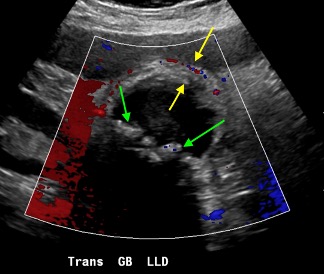
The green arrows point to echogenic foci within the gallbladder lumen with associated posterior acoustic shadowing compatible with cholelithiasis. The yellow arrows point to a markedly thickened and edematous gallbladder wall with associated gallbladder wall hyperemia (increased flow on color Doppler images). In addition, there is pericholecystic fluid and the patient reported severe abdominal pain from pressure of the ultrasound probe over the gallbladder (positive sonic Murphy sign).
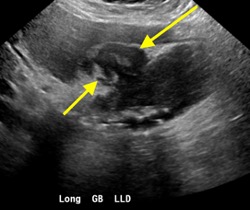

The ultrasound study also shows a focus of gallbladder wall discontinuity with a complex fluid collection between the gallbladder and liver. CT was recommended for further evaluation.
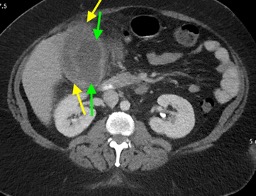
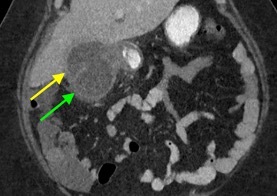
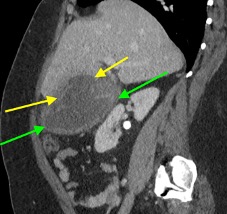
CT redemonstrates a markedly thickened gallbladder wall with pericholecystic free fluid and surrounding fat stranding (green arrows). There is focal discontinuity of the gallbladder wall with a complex fluid collection in the subhepatic space between the liver and gallbladder (yellow arrows).
Diagnosis: Acute cholecystitis with type 2 gallbladder perforation and subhepatic abscess formation
Gallbladder perforation is a severe complication of acute cholecystitis that occurs in less than 5% of cases but increase morbidity and mortality. It tends to occur in elderly patients or patients with underlying chronic medical conditions. It presents with right upper quadrant pain.
Acute cholecystitis is most often caused by a gallstone obstructing the cystic duct, which leads to retention of secretions within the gallbladder and resultant gallbladder distention. Eventually, the intraluminal pressure exceeds the arterial perfusion pressure and obstructs venous drainage causing ischemia / necrosis of the gallbladder wall with subsequent perforation. The gallbladder fundus is the most common site of perforation as it receives the terminal blood supply. Perforation can also occur in the setting of trauma.
Perforation can occur between two days to several weeks after the onset of acute cholecystitis. There are four types of perforation according to the Neimeier classification:
- Type 1: Acute free perforation of the gallbladder with generalized peritonitis
- Type 2: Subacute perforation of the gallbladder with localized pericholecystic abscess and phlegmon (the most common type)
- Type 3: Chronic perforation of the gallbladder with choecystoenteric fistula formation
- Type 4: Perforation into the biliary tree with cholecystobiliary fistula formation
Additional complications include intraperitoneal free air, bile leak, hepatic abscess (via direct extension or hematogenous dissemination), and small bowel obstruction among others.
Treatment includes cholecystectomy and abscess drainage with or without preceding percutaneous cholecystostomy tube placement to relieve the infection and inflammation prior to surgery. Additional procedures such as fistula repair may be necessary.
References:
- Anderson BB, Nazem A. Perforations of the gallbladder and cholecystobiliary fistulae: a review of management and a new classification. J Natl Med Assoc. 1987; 79(4): 393-9.
- Derici H, Kara C, Bozdag AD et-al. Diagnosis and treatment of gallbladder perforation. World J. Gastroenterol. 2006;12 (48): 7832-6.
- Patel NB, Aytekin O, Thomas S. Multidetector CT of emergent biliary pathologic conditions. Radiographics. 2013;33:1867-88.
- Madrazo BL, Francis I, Hricak H, Sandler MA, Hudak S, Gitschlag K. Sonographic findings in perforation of gallbladder. AJR Am J Roentgenol 1982;139(3):491-496.